SWR2310 Series Technical Reference
Firmware revision: Rev.2.04.01
Thank you for your purchase of the Yamaha SWR2310 Series.
Please read this manual carefully, correctly installing the unit and making the proper settings before use.
Make sure to observe the warnings and cautions listed in this manual, in order to use the unit correctly and safely.
Startup guide
This explains the procedure for preparing to set up the SWR2310 Series that you purchased.
Settings for the SWR2310 Series can be made using the following four methods.
- Make settings via the Web GUI
- Make settings via commands using the CONSOLE port
- Make settings via commands using Telnet
- Make settings via commands using SSH
This document explains “Preparing to make settings via the Web GUI” and “Preparing to make settings via the CONSOLE port.”
Preparing to make settings via the Web GUI
You’ll log into the Web GUI from Yamaha LAN Monitor, so install Yamaha LAN Monitor before you proceed.
Before you log in, connect the computer to the same network.
For details on supported web browsers, refer to the Yamaha Pro Audio website.
http://www.yamaha.com/proaudio/
- Prepare the computer and other items you’ll need when making settings.
- Obtain an Enhanced Category 5 cable (CAT5e) for connecting to this unit.
- The following web browsers are recommended for use.
- Windows
- Internet Explorer 11, EDGE, Google Chrome, Mozilla FireFox
- Mac, iOS
- Apple Safari 7.0 or later
- Connect this unit to the computer via an Enhanced Category 5 cable (CAT5e).
- Power-on this unit. This unit takes approximately 70 seconds to start up.
When startup is completed, the indicator of the LAN port to which the Ethernet cable is connected will light according to the communication speed and mode. - Start Yamaha LAN Monitor.
- Select the device for which you want to make settings, and in the “Device details” view, click the Web GUI button.
When access succeeds, a dialog box asking you to enter a user name and password appears. - If you have previously specified them, enter a user name and password, and click the [Login] button.
With the factory settings, no user name or password have been specified, so you don’t need to enter a user name or password. - Subsequently, make settings as appropriate for the system in which this unit is being used.
- For details on settings via the Web GUI, refer to Help within the GUI that you accessed.
Preparing to make settings via the CONSOLE port
- Prepare the computer and other items you’ll need when making settings.
When making settings via the CONSOLE port, use a USB cable or RJ-45/DB-9 console cable.
As the USB cable for connection to the mini-USB CONSOLE port, use a USB cable that supports data transfer and is equipped with a USB Type A connector and a mini-USB Type B (5-pin) connector. Charging-only cables cannot be used.
You’ll also need terminal software for controlling the serial (COM) port of the computer.
Set the communication settings of the console terminal as follows.- Baud rate
- Data
- Parity
- Stop bit
- Flow control
: 9600 bps
: 8 bits
: none
: 1 bit
: Xon/Xoff - For the connection between the computer and this unit, use a USB cable or a RJ-45/DB-9 console cable.
- In order to use the mini-USB CONSOLE port, you must first install the USB serial driver.
- For details on how to install the USB serial driver, refer to “Yamaha Network Device USB Serial Driver Installation Guide.”
The Yamaha Network Device USB Serial Driver Installation Guide and the installer can be downloaded from the following website.
https://usa.yamaha.com/products/contents/proaudio/downloads/firmware_software/index.html?k=&c=proaudio
- Power-on this unit. This unit takes approximately 70 seconds to start up.
Immediately after startup, the serial console screen appears as follows.SWR2310-28GT BootROM Ver.1.00 Starting ............................. SWR2310-28GT Rev.2.04.01 (Thu Sep 26 17:35:20 2019) Copyright (c) 2018-2019 Yamaha Corporation. All Rights Reserved. - Log in to this unit.
In the initial state, a user name and password have not been specified, so you’ll be able to log in by pressing the “Enter” key at the user name input prompt and the password input prompt.Username: (Input the “Enter” key) Password: (Input the “Enter” key) SWR2310-28GT Rev.2.04.01 (Thu Sep 26 17:35:20 2019) Copyright (c) 2018-2019 Yamaha Corporation. All Rights Reserved. SWR2310>
- Subsequently, make settings as appropriate for the system in which this unit is being used.
- For details on settings via the serial console, refer to Command Reference.
Firmware Updates
For stable operation, we recommend that you apply the latest firmware updates, which include new functionality and bug fixes.
Please confirm your system version before applying updates.
- Use the show environment command to check the system version.
Web GUI Function
The latest firmware for this unit supports the following settings and functions.
- Detailed settings
- Interface settings
- Link aggregation
- VLAN
- MAC address table
- Routing
- DNS client
- IGMP Snooping
- Access list
- QoS
- Mail notification
- Terminal monitoring
- Management
- Unit settings
- Time settings
- Access management
- User settings
- Server settings
- External device linking
- microSD
- Dante optimization settings
- Maintenance
- Command execution (For details on the commands, refer to the Command Reference.)
- Firmware update
- CONFIG file management
- Statistical data management
- SYSLOG management
- Restart and initialization
- Web GUI language
- Unit settings
Precautions
- Do not touch the inside of ports with fingers or metallic objects, etc. Doing so might cause malfunctions.
- Do not use this unit in locations of direct sunlight (such as inside a car located in the sun), in extremely hot locations such as near a stove, in extremely cold locations, nor in locations that are excessively dusty or are subject to strong vibration. Such conditions might cause this unit’s panel to deform or internal components to malfunction, or might cause unstable operation.
- Products made of vinyl, plastic, or rubber should not be placed on this unit. Such objects might cause this unit’s panel to be discolored or damaged.
- To clean this unit, use a soft dry cloth. Do not use benzene, thinner, detergent, or a chemically treated cloth, such things might cause discoloration or damage.
- If the ambient temperature in which this unit is located undergoes extreme change (such as when the unit is moved or is subject to aggressive air-conditioning or heating), and there is a danger that condensation has formed within the unit, leave the unit unpowered for several hours to ensure that condensation has disappeared before using the unit. Using the unit when condensation is present might cause malfunctions.
- Before touching this unit, remove static charge from yourself and your clothing. Static charge might cause malfunctions.
- Do not place this unit in locations where there is a strong magnetic field. Such conditions might cause malfunctions.
- Do not connect equipment that generates noise to the same electrical power supply line as this unit. Such conditions might cause malfunctions or faulty operation.
- Do not route communication cables near power cords. High voltages might be induced, causing faulty operation.
- When using a 1000BASE-T connection, use enhanced category 5 (CAT5e) or better LAN cable.
- Do not connect any SFP module to the SFP port other than the separately sold SFP-SWRG-SX or SFP-SWRG-LX. Operation cannot be guaranteed if any other SFP module is connected.
- Do not connect any SFP module or DAC other than the separately sold SFP-SWRT-SR, SFP-SWRT-LR, SFP-SWRG-SX, SFP-SWRG-LX, DAC-SWRT-1M, DAC-SWRT-3M in the SFP+ port. Operation cannot be guaranteed if any SFP module or DAC other than the above is connected.
- Attach the dust cover to SFP ports that are not in use. Foreign objects that enter the port might cause malfunctions. Keep the dust covers in a safe place so that they will not be lost.
- SFP modules and optical fiber cables can suffer problems such as loss of accuracy caused by damage or abrasion to their connector, or dirty contacts, causing insufficient light reception or failure to link up.
- The legs (rubber feet) included with this unit are to prevent slipping. Use them when placing this unit on a table or stand that is prone to slipping.
- SWR2310 Series Technical Data (GUI)
- Overall
- Introduction
Introduction
1. What you can do using the Web GUI
The Web GUI lets you perform basic settings and management of the Yamaha switch (this unit). The Web GUI contains the following screens for you to make settings and perform management.
- Dashboard
- LAN MAP
- Detailed settings
- Management
- CONFIG
- TECHINFO
2. Operating environment
Here we explain the environment that is required in order to use the Web GUI.
Recommended web browser
We recommend the following web browser for use with the Web GUI.
- Windows
- Microsoft Edge
- Microsoft Internet Explorer 11
- Google Chrome
- Mozilla Firefox
- Mac
- Apple Safari
- iOS
- Apple Safari
The latest version of each browser is recommended.
<NOTE>
- Do not use the [Back] or [Forward] buttons of the web browser.
- In some cases, the display layout of a page may become disordered. If this occurs, please access that page once again.
<Memo>
- The Web GUI uses UTF-8 character encoding.
JavaScript settings
The Web GUI uses JavaScript. If your web browser is set to disable JavaScript, you might not be able to use the Web GUI itself.
In advance, please enable JavaScript as described in the following procedure.
- Settings for Internet Explorer 11 (Windows version)
- On the menu bar of Internet Explorer, choose “Tools.”
* If the menu bar is not visible, press the <Alt> key of the keyboard to make it appear.
- In the menu that appears, choose “Internet options.”
- Select the “Security” tab.
- Verify that “Internet” (the globe symbol) is shown, and press the [Default level] button.
If you can’t press this button, “Default level” is already selected. Proceed to step 5.
Alternatively, you can use the following method.
- Press the [Custom level] button to open the “Security Settings - Internet Zone” dialog box.
- Under “Scripting,” choose “Enable” for each of the two items “Scripting of Java applets” and “Allow Programmatic clipboard access.”
- Press [OK]. The warning “Do you want to change the settings of this zone?” is shown. Press [Yes]. You will return to “Internet Options.” Press the [OK] button.
- You will return to “Internet Options.” Press the [OK] button.
- On the menu bar of Internet Explorer, choose “Tools.”
- Settings for Google Chrome (Windows version)
- Press the Google Chrome menu button.
- On the menu that appears, select “Settings (S)”.
- Select the “Advanced settings” in the lower part of the page.
- In the “Privacy and security” section, select “Content settings”.
- Select “JavaScript”.
- Move the slider to the right to “Allowed (recommended)”.
- For details on JavaScript settings for Google Chrome, refer to the Google Chrome support page (external site).
- Settings for Mozilla Firefox (Windows version)
- For details on JavaScript settings for Firefox, refer to the Firefox support page (external site).
- Settings for Safari (Mac version)
- On the menu, select “Safari” and choose “Preferences.”
- In the window that appears, choose “Security.”
- Add a check mark for “Allow plug-ins” and “Enable JavaScript.”
- Settings for Safari (iOS version)
- On the home screen, select “Settings”.
- Select “Safari”.
- Select “Advanced”.
- Move the “JavaScript” slider to the right to enable.
Cookie settings
The Web GUI uses cookies. If your web browser is set to disable cookies, you might not be able to use the Web GUI itself.
Follow the steps below to allow cookies in order to use the Web GUI.
- Settings for Internet Explorer 11 (Windows version)
- On the menu bar of Internet Explorer, choose “Tools.”
* If the menu bar is not visible, press the <Alt> key of the keyboard to make it appear.
- In the menu that appears, choose “Internet options.”
- Select the “Privacy” tab.
- Move the slider that indicates the privacy level to “Medium-High”, “Medium”, “Low” or “Accept all cookies”, and press the [OK] button.
Note: If you have no special reason to do so otherwise, we recommend the “Medium-High” or “Medium” setting.
- On the menu bar of Internet Explorer, choose “Tools.”
- Settings for Google Chrome (Windows version)
- Press the Google Chrome menu button.
- On the menu that appears, select “Settings (S)”.
- Select the “Advanced settings” in the lower part of the page.
- In the “Privacy and security” section, select “Content settings”.
- Select “Cookies”.
- Move the topmost slider to the right, to enable “Allow sites to save and read cookie data (recommended)”.
- Settings for Mozilla Firefox (Windows version)
- Press the Mozilla Firefox menu button.
- In the menu that appears, choose “Preferences”.
- Select the “Privacy” panel.
- Select “Remember history” from the drop-down list box in the “History” section.
- Settings for Safari (Mac version)
- On the menu, select “Safari” and choose “Preferences”.
- In the window that appears, choose “Privacy”.
- For the “Cookies and website data” setting, select a setting other than “Always block”.
- Settings for Safari (iOS version)
- On the home screen, select “Settings”.
- Select “Safari”.
- Select “Block Cookies”.
- Select a setting other than “Always block”.
3. User access rights
Users who log in to the Web GUI are divided into two types: general users and administrative users. These are referred to as “access levels.” The differences between the access levels are described below.
- For general users
Can view the settings of the unit. Cannot change the settings.
- For administrative users
Can view and change the settings of the unit. The user can also obtain CONFIG and TECHNIFO.
4. Note when using together with command input
Settings for this unit can be made not only via the Web GUI but also from the command console screen by directly entering commands. Command input allows a broader range of settings than when using the Web GUI, and also lets you make settings for functions that are not supported in the Web GUI. If you use both command input and the Web GUI to make settings, be aware that the commands that you input may be overwritten, or the settings may be cleared.
<Memo>
- The command console screen contains the following items.
- Management -> “Maintenance” -> “Command execution”
- For details on commands, refer to “Command reference.”
- SWR2310 Series Technical Data (GUI)
- Overall
- Login/Logout
Login/Logout
1. Login page
Start your web browser, and access “http://(the IP address you assigned to this unit)/” to display the login page.
The following items are shown on the login page.
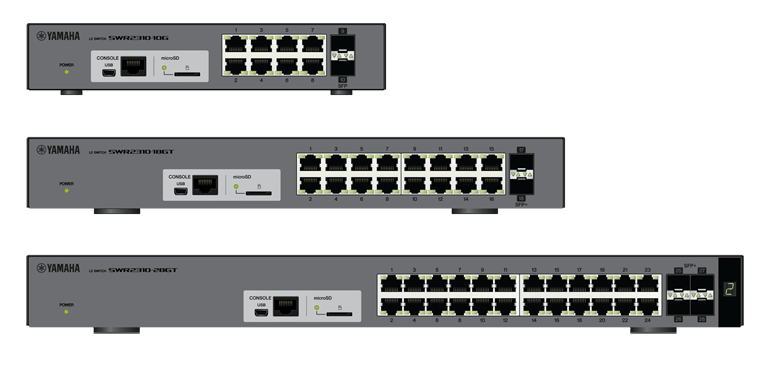
- Model name ( Ex. : SWR2310-18GT )
- hostname ( Name configured using the hostname command )
- Input box for user name
- Input box for password
- [Login] button
If login fails, the following error messages are displayed.
- Incorrect user name or password
Login failed. The user name or password is incorrect.
- Maximum number of sessions have been reached
Login failed. The maximum number of sessions has been reached.
Note: Refer to “4. About sessions” for details on sessions.
2. Login method
Here we explain how to log in to the Web GUI of this unit.
- Start your web browser, and access the login page.
- Enter the user name and login password, and press the [Login] button.
Logging in as a guest user
- Leaving the user name input box empty, enter the login password (configured using the “password” command) or the administrator password (configured using the “enable password” command).
- When using a login password to login, you will be logged in as a general user.
- When using an administrator password to login, you will be logged in as an administrative user.
- When the password entered matches both the login password and the administrator password, you will be logged in as an administrative user.
Logging in as a registered user
- Enter the user name and password that were configured using the “username” command.
- When logging in as a user without administrative privileges, you will be logged in as a general user.
- When logging in as a user with administrative privileges, you will be logged in as an administrative user.
<About general users and administrative users>
- General User If you log in as a general user, you will be able to view this unit’s settings and operating status. You will not be able to make settings for this unit.
- Administrative User If you log in as an administrative user, you will be able to perform all Web GUI operations. You can view the unit’s settings and operating status, and configure the settings for this unit.
<About passwords>
- You must enter the password as single-byte characters. Double-byte characters may not be used. Uppercase and lowercase characters are distinguished.
- Take care not to forget the password that you assigned. If you have forgotten the password, ask the administrator who set up this unit for the correct password.
<NOTE>
- You will not be able to properly login if the browser is configured to block cookies.
- In this case, configure the cookie settings first in 2. Operating environment.
3. Logout method
- In the upper right of the screen, press the [Logout] button to display the “Log out” dialog box.
- Press the [Login screen] button in the dialog box to go to the login page.
4. About sessions
- If you can successfully login to the Web GUI, a session will be established between the browser in use and this unit.
- Each time you login from a different browser or device, a new session is established.
- The session will be maintained until you log out or the session times out.
- Sessions that have been established will time out after five minutes have elapsed from the last data communication.
- Up to four sessions can be established at one time.
- Information for a session can be checked using the “show users” command.
- SWR2310 Series Technical Data (GUI)
- Overall
- About each screen
About each screen
1. Dashboard
It shows the various system information of this device in visual form. You can check and monitor the following status.
- Interface information
- System information
- Resource information ( CPU Utilization / Memory Utilization )
- SYSLOG
- Terminal monitoring
- Traffic information ( Transmit / Reception )
- Resource information ( Graph )
2. LAN MAP
In this page you can view, manage, and make settings for the Yamaha network devices managed by the LAN interface, and any equipment under its management.
The LAN map is shown only if this unit is operating as a master.
3. Detailed settings
In this page you can make detailed network-related settings for this unit. The following items are provided.
- Interface settings
- Link aggregation
- VLAN
- Create VLAN
- Tag VLAN
- Multiple VLAN
- MAC address table
- Routing
- DNS client
- IGMP snooping
- Access list
- Create Access list
- Apply Access list
- QoS
- Mail notification
- Terminal monitoring
4. Management
In this page you can make settings for this unit, and perform maintenance. The following items are provided.
- Unit settings
- Access management
- User settings
- Various server settings
- External devices
- microSD
- Dante optimization
- Maintenance
- Command execution
- Update firmware
- CONFIG management
- Summary data management
- SYSLOG management
- Restart and initialization
- GUI display language
5. CONFIG
The results of running the “show running-config” command (a setting of this unit) can be viewed in a web browser or acquired as a text file.
- Viewing CONFIG
- In the “CONFIG” menu, press the [Show in browser] button. The execution result of the “show running-config” command is shown in a sub-window.
- To close, press the web browser’s close button.
- Obtaining CONFIG as a text file
- In the “CONFIG” menu, press the [Obtain as text file] button to start the download automatically.
- The name of the acquired file is “config_YYYYMMDDhhmmss.txt”.
YYYY ... A.D. ( 4 Digit ) MM ... Month ( 2 Digit ) DD ... Day ( 2 Digit ) hh ... Hours ( 2 Digit ) mm ... Minutes ( 2 Digit ) ss ... Seconds ( 2 Digit )
6. TECHINFO
The “show tech-support” command lets you view status information for all of this unit’s functions.
In the “TECHINFO” menu, the results of running the “show tech-support” command can be viewed in a web browser or acquired as a text file.
- Viewing TECHNIFO
- In the “TECHINFO” menu, press the [Show in browser] button. The execution result of the “show tech-support” command is shown.
- To close, press the web browser’s close button.
- Obtaining TECHNIFO as a text file
- In the “TECHINFO” menu, press the [Obtain as text file] button to start the download automatically.
- The name of the acquired file is “technifo_YYYYMMDDhhmmss.txt”.
YYYY ... A.D. ( 4 Digit ) MM ... Month ( 2 Digit ) DD ... Day ( 2 Digit ) hh ... Hours ( 2 Digit ) mm ... Minutes ( 2 Digit ) ss ... Seconds ( 2 Digit )
- Notes
- It may take some time to obtain TECHNIFO.
- This unit may undergo loading while the information is being acquired.
- SWR2310 Series Technical Data (GUI)
- Dashboard
- About the dashboard
About the dashboard
Using the dashboard- What is the dashboard?
- The page that provides visualization and monitoring of various system information and status information is called the “dashboard.”
- When a parameter being monitored exceeds the threshold value, it is shown in a warning field, helping you to determine the cause of a problem or to perform troubleshooting.
- What is a gadget?
- Each window shown in the dashboard is called a “gadget.”
- A gadget that you want to monitor can be placed anywhere you like.
- Information for each gadget is automatically updated at regular intervals.
The dashboard shows the following buttons.
- About the [Stack switch] button
- If the stack configuration is enabled, the [Stack switch] button will be displayed at upper left.
- Select a stack ID to display the stack information selected on the following gadgets.
- System information
- Resource information
- Interface information
- Resource information ( Graph )
- This can only be selected for stacks with active status.
- The master stack will be selected on the initial screen.
- Information for selected stacks for separated gadgets will be shown per gadget at the next update timing.
About the “Gadget” button
- From the “gadget” buttons (
- From the “gadget” buttons (
- A maximum of 32 warnings are shown, from newest to oldest.
- Each of the displayed gadgets monitors the situation, and when an abnormal situation or a high load is detected, the “Warning” button (
- The list of warnings shows the contents of the currently detected warnings in order of recentness.
- Date and time that the abnormality was detected
- Gadget that detected the abnormality
- Detected content
- The bar of the gadget that is the object of the warning is also shown with a flashing “Warning” button.
- When the following conditions are satisfied, the warning will stop being displayed (the conditions differ depending on the detected content).
- Recovered from an abnormal state (for example, the usage ratio or the throughput fell below the threshold)
- The state was cleared (for example, the settings were changed or the port linked down)
- The “Clear” button (
(*) Note that even if you press the “Clear” button so that the warning is not shown in the warning list, it is not the case that the abnormal state has been resolved.
- If all warning indications disappear, the “Warning” button stops flashing, and the warning list disappears.
- You can press the “Warning” button to open or close the warning list.
- You cannot open the warning list and the warning history list at the same time.
- The warning history is shown in order of newness, for a maximum of 64 items.
- The warning history is shown in bold, but warnings that were cleared by the “Clear” button in the warning list are shown in thin characters.
- If there are unconfirmed warning history items that have not been cleared, the lower right of the “History” button (
If this number is displayed, check the contents of the warnings that have occurred in the warning history list.
- When you press the [OK] button (
- In the warning history list, pressing the “Confirm all” button (
- In the warning history list, pressing the “Delete all” button (
- You can press the “History” button to open or close the warning history list.
- You cannot open the warning list and the warning history list at the same time.
 About the “Gadget” button
 About the “Warning” button
 ) of the warning list was pressed (*)
 About the “History” button
 ).
). ) of each item in the warning history list, it changes to thin characters as a confirmed history item, and the [OK] button disappears.
 ) changes all history entries to a confirmed state.
 ) deletes all history.
The following gadgets can be used.
- System information
- Resource information
- Interface information
- SYSLOG
- Terminal monitoring
- Traffic information ( Transmit / Reception )
- Resource information ( Graph )
- Stack information
Each gadget has the following functions.
- Add gadget:
- Press the “Gadget” button (
- Gadgets are always added to the far upper left of the dashboard.
- Press the “Gadget” button (
- Delete gadget:
- Press the “Gadget” button (
- You can also delete a gadget by pressing the “Close” button (
- Press the “Gadget” button (
- Move gadget:
- When you place the mouse over each gadget, the mouse pointer changes to a move symbol, allowing you to drag the gadget to a desired position.
- Candidates for the gadget’s movement destination are shown in gray.
- The interface information gadget cannot be moved.
- Separate the gadget screen:
- A “Separate” button (
- If you press the “Separate” button, that gadget alone is shown in a different window.
- At this time, the corresponding gadget in the dashboard is indicated as “In separate window.”
- If a gadget is separated, the following occurs.
- The “Separate” button is no longer shown for the separated gadget.
- When you update the dashboard display, all separated gadgets return to the dashboard and are shown.
- When you close the dashboard, all separated gadgets are also closed.
- Separated gadgets can also be displayed by specifying a URL directly in the browser.
When a URL has been directly specified, the master stack will be displayed.
Example) System information gadget:http://192.168.100.1/dashboard/system.html
- A “Separate” button (
- Minimize gadget:
- When you press the minimize icon (
- When you press it again, the icon returns to its original downward orientation (
- When you press the minimize icon (
- Save gadget position information:
- When you add, delete, or move a gadget, or when you minimize and restore it, the position data of the gadget is saved.
- This information is also saved when the power is turned off and on again.
- This data is initialized if you return the device to its factory-set state.
- If a general user logs in, the gadget position information is not saved.
- Auto-update gadget:
- All gadgets are automatically updated at regular intervals.
- The update interval differs depending on the gadget.
- Warning display:
- When an abnormal condition or a high load is detected by a gadget, a flashing “Warning” button (
- The following states will initiate this warning.
Gadget Trigger System information When reboot because of startup is detected The CPU temperature exceeds 75°C or 100°C. The PHY temperature exceeds 85°C or 110°C. The SFP module temperature exceeds 65°C or 80°C. The temperature sensor exceeds 60°C or 70°C. When the PSE temperature exceeds 135°C. The fan stops. The fan speed increases. Resource information When CPU usage exceeds 80% When memory usage exceeds 80% Interface information An loop occurs. The SFP optical Rx level exceeds the upper limit. The SFP optical Rx level falls below the lower limit. Traffic information The throughput exceeds the link speed of 60%. Stack information The stack port changed state to down. The stack port changed state to up. The heartbeat error was detected. This unit was promoted from a slave to a master.
- When an abnormal condition or a high load is detected by a gadget, a flashing “Warning” button (
 ) in the upper right of each gadget.
 ) is shown in the upper right of each gadget.
 ) in the upper left of each gadget, the icon turns sideways (
 ) and the gadget display is minimized.
| Interface information |
1 2 3 4 5 6 7 8 9 10 |
- The “Port” icon display lets you check the link status of the ports.
- When you move the mouse cursor over the “Port” icon, detailed port information is shown.
- The “Port” icon will display as follows, according to the link status.
Link status:For a LAN port
Icon Explanation Link up (port speed 1000BASE-T) Link up (port speed 100BASE-TX) Link up (port speed 10BASE-T) Link down Error occurrence( Loop detection, Shutdown by BPDU guard, Shutdown by port-security ) Link status:For an SFP port
Icon Explanation Link up (port speed 10GbE) Link up (port speed 1GbE) Link down Error occurrence( Loop detection, Shutdown by BPDU guard, Shutdown by port-security, Optical RX power error )
| System information |
- Device name:
- Display the device name of the switch.
- Firmware revision:
- Firmware revision
- Serial number:
- Serial number of the device
- This is also shown by a label on the rear of the chassis.
- MAC address:
- MAC address of the device
- This is also shown by a label on the rear of the chassis.
- Currently-running firmware:
- The currently started firmware is shown..
- When it starts from firmware stored in an external memory, shown like “exec(SD)”.
- Currently-running settings file:
- The currently used CONFIG file is shown.
- Select config0 - config4 using the startup-config select command.
- System time:
- Current device date and time
- If the date and time are incorrect, set the date and time either in the Web GUI’s “Management” -> “Device settings” page, or by using the clock set command or the ntpdate command.
- Startup time:
- System startup date and time
- Startup reason:
- Reason for startup
- Start from power-off state, reload command, revision up, etc.
- If reboot is detected as the startup reason, the background turns red, and a warning indication (
- Check with the network administrator.
- In the warning list, press the “Clear” button (
- Fan speed :
- Displays the speed of each fan.
- Internal chassis temperature :
- Displays the temperature inside the chassis.
- SFP optical RX level :
- Displays the SFP optical Rx level state and the connection module.
| Resource information |
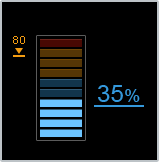
- The current values and peak values of CPU usage and memory usage are shown.
- The number at the right of the meter is the current usage, and the number at the left is the peak value.
- You can clear the previous peak value from [Clear peak value].
- Peak values are also cleared when you restart the device.
- When you move the mouse cursor to each meter, the peak value and the date and time at which the peak value was recorded are shown.
- If the CPU usage exceeds 80% , a warning display (
- Note the date and time at which the peak value was recorded, and from other gadgets, note the traffic and the log that were occurring during that time.
- If the memory usage exceeds 80% , a warning display (
- Note the date and time at which the peak value was recorded, and from other gadgets, note the traffic and the log that were occurring during that time.
| SYSLOG |
- The most recent log is at the top.
- In the select menu you can change the number of lines that are displayed (default: 10 lines).
| Terminal monitoring |
Displays a list of monitored devices and the status of each.
- Devices that are determined to be up, down, not started yet (“Idle”) and all monitored devices (“All”) are counted respectively.
- Displays the monitored target, device name, monitoring type and status for each monitored device.
- Point the mouse cursor above a status column to show the status for that monitored device.
- Press the [Up], [Down], [Idle], and [All] buttons to show only the monitored devices for those statuses.
- When not even one monitored device is registered, “The monitoring devices have not been registered” will be displayed.
| Traffic information |
The physical interface traffic is displayed on a graph.
There are different gadgets for the transmission traffic and for the reception traffic.
- Use the [Live], [Day], [Month], and [Year] buttons to change the graph rendered.
- [Live]
- Traffic can be viewed for the previous two minutes.
- The graph will be automatically refreshed each second.
- [Day]
- Displays traffic per hour for the specified date.
- The day can be set using the day specification box at the top right of the gadget.
- Press the date specification box to display the calendar, and select the day to show the graph for the day specified.
- A date within one year to the past can be set using the calendar.
- [Month]
- Displays traffic per day for the specified month.
- The month can be set using the month specification box at the top right of the gadget.
- Press the month specification box to display the calendar, and select the month to show the graph for the day specified.
- A past month within one year can be set using the calendar.
- [Year]
- Displays traffic per month for the specified year.
- The year can be set using the year specification box at the top right of the gadget.
- Press the year specification box to display the calendar, and select the year to show the graph for the year specified.
- The year specification box can be used to specify either the current year or the previous year.
- [Live]
- Press the “Interface selection” button (
- Select the interface to display on the graph, from the “Interface selection” dialog box.
- The average traffic per hour for the interface is rendered on the graph.
- Up to 8 lines can be displayed on the graph using the colors blue, salmon pink, yellow, green, gray, sky blue, pink and purple for a total of 8 colors.
- These colors are allocated in the order that they are rendered on the graph, from the newest interface numbers onwards.
- The Y-axis upper limit grows with the traffic, from a minimum of 10 [Mbps] to a maximum of 10000 [Mbps].
- The information shown below is shown on the graph for the specified period that is rendered.
- Live : Current time - time 120 sec. ago (hh:mm:ss format)
- Day : 0 o’clock - 23 o’clock
- Month : 1st - 28th, 29th, 30th, 31st
- Year : Jan - Dec
- Point the mouse cursor above a line on the graph to show the interface information, date and traffic amount.
- A legend for the currently displayed graph is shown at the lowermost part of the gadget.
- Using the legend
- Only the lines on the graph that are enabled using the check boxes in the legend will be displayed.
- Deselecting the check boxes will hide the corresponding lines from the graph.
- This is useful when multiple lines are overlapping or when you wish to temporarily monitor a specific interface only.
- If the interface you are currently monitoring does not exist, the message “The currently monitored interface is not selected” will display.
- Refresh the screen to restore the rendered time period and the selections on the legend to their defaults, as shown below.
- Rendered period : Live
- Legend check boxes : All applied
- If the traffic exceeds 60%, a warning (
- If the traffic falls below 50%, the warning will be cancelled.
- When displaying a gadget in a separate window using the “Separate” button ()
- The settings prior to being separated will be reflected in the settings for the interface currently being monitored.
- The rendered time period and the selections on the legend return to their defaults.
- The settings for the interface selected in a separated window will be reflected in the dashboard gadget when the separated screen is closed.
- When directly inputting the URL for a separated window and displaying a gadget
- The rendered time period and the selections on the legend return to their defaults.
 ) to display the “Interface selection” dialog box.
| Resource information(Graph) |
This shows the CPU usage and memory usage in graph format.
- Use the [Live], [Day], [Month] and [Year] buttons to change the graph rendered.
- [Live]
- Traffic can be viewed for the previous two minutes.
- The graph will be automatically refreshed each second.
- [Day]
- Displays traffic per hour for the specified date.
- The day can be set using the day specification box at the top right of the gadget.
- Press the date specification box to display the calendar, and select the day to show the graph for the day specified.
- A date within one year to the past can be set using the calendar.
- [Month]
- Displays traffic per day for the specified month.
- The month can be set using the month specification box at the top right of the gadget.
- Press the month specification box to display the calendar, and select the month to show the graph for the day specified.
- A past month within one year can be set using the calendar.
- [Year]
- Displays traffic per month for the specified year.
- The year can be set using the year specification box at the top right of the gadget.
- Press the year specification box to display the calendar, and select the year to show the graph for the year specified.
- The year specification box can be used to specify either the current year or the previous year.
- [Live]
- The average usage ratio is rendered per hour for the monitored period.
- The CPU usage is shown on the graph using blue lines, and the memory usage is shown using salmon pink lines.
- The upper limit for the graph’s Y axis is 100 [%].
- The information shown below is shown on the graph for the specified period that is rendered.
- Live : Current time - time 120 sec. ago (hh:mm:ss format)
- Day : 0 o’clock - 23 o’clock
- Month : 1st - 28th, 29th, 30th, 31st
- Year : Jan - Dec
- Point the mouse cursor above a line on the graph to show the monitored period, date and time and usage ratio.
- A legend for the currently displayed graph is shown at the lowermost part of the gadget.
- Using the legend
- Only the lines on the graph that are enabled using the check boxes in the legend will be displayed.
- Deselecting the check boxes will hide the corresponding lines from the graph.
- Refresh the screen to restore the rendered time period and the selections on the legend to their defaults, as shown below.
- Rendered period : Live
- Legend check boxes : All applied
- If the CPU usage exceeds 80%, a warning (
- If the CPU usage falls below 80%, the warning will be cancelled.
- If the memory usage exceeds 80%, a warning (
- If the memory usage falls below 80%, the warning will be cancelled.
- When displaying a gadget in a separate window using the “Separate” button ()
- The rendered time period and the selections on the legend return to their defaults.
- When directly inputting the URL for a separated window and displaying a gadget
- The rendered time period and the selections on the legend return to their defaults.
| Stack information |
- Stack function
- Displays whether the stack function is enabled.
- Members
- Displays the stack member types and roles.
- Status
- Displays the stack member status.
- Only displayed when the stack function is enabled.
- SWR2310 Series Technical Data (GUI)
- Dashboard
- About each gadget
About each gadget
Interface information
Displays the link status of the ports.

- The “Port” icon display lets you check the link status of the ports.
- When you move the mouse cursor over the “Port” icon, detailed port information is shown.
- The “Port” icon will display as follows, according to the link status.
Link status:For a LAN port
Icon Explanation Link up (port speed 1000BASE-T) Link up (port speed 100BASE-TX) Link up (port speed 10BASE-T) Link down Error occurrence( Loop detection, Shutdown by BPDU guard, Shutdown by port-security ) Link status:For an SFP port
Icon Explanation Link up (port speed 10GbE) Link up (port speed 1GbE) Link down Error occurrence( Loop detection, Shutdown by BPDU guard, Shutdown by port-security, Optical RX power error )
System information
The following information is displayed.
- Device name:
- Display the device name of the switch.
- Firmware revision:
- Firmware revision
- Serial number:
- Serial number of the device
- This is also shown by a label on the rear of the chassis.
- MAC address:
- MAC address of the device
- This is also shown by a label on the rear of the chassis.
- Currently-running firmware:
- The currently started firmware is shown..
- When it starts from firmware stored in an external memory, shown like “exec(SD)”.
- Currently-running settings file:
- The currently used CONFIG file is shown.
- Select config0 - config4 using the startup-config select command.
- System time:
- Current device date and time
- If the date and time are incorrect, set the date and time either in the Web GUI’s “Management” -> “Device settings” page, or by using the clock set command or the ntpdate command.
- Startup time:
- System startup date and time
- Startup reason:
- Reason for startup
- Start from power-off state, reload command, revision up, etc.
- If reboot is detected as the startup reason, the background turns red, and a warning indication (
- Check with the network administrator.
- In the warning list, press the “Clear” button (
- Fan speed :
- Displays the speed of each fan.
- Internal chassis temperature :
- Displays the temperature inside the chassis.
- SFP optical RX level :
- Displays the SFP optical Rx level state and the connection module.
Resource information
This page shows the CPU usage and memory usage.
- The current values and peak values of CPU usage and memory usage are shown.
- The number at the right of the meter is the current usage, and the number at the left is the peak value.
- You can clear the previous peak value from [Clear peak value].
- Peak values are also cleared when you restart the device.
- When you move the mouse cursor to each meter, the peak value and the date and time at which the peak value was recorded are shown.
- If the CPU usage exceeds 80% , a warning display (
- Note the date and time at which the peak value was recorded, and from other gadgets, note the traffic and the log that were occurring during that time.
- If the memory usage exceeds 80% , a warning display (
- Note the date and time at which the peak value was recorded, and from other gadgets, note the traffic and the log that were occurring during that time.
SYSLOG
This shows the most recent SYSLOG.
- The most recent log is at the top.
- In the select menu you can change the number of lines that are displayed (default: 10 lines).
Terminal monitoring
Displays a list of monitored devices and the status of each.
- Devices that are determined to be up, down, not started yet (“Idle”) and all monitored devices (“All”) are counted respectively.
- Displays the monitored target, device name, monitoring type and status for each monitored device.
- Point the mouse cursor above a status column to show the status for that monitored device.
- Press the [Up], [Down], [Idle], and [All] buttons to show only the monitored devices for those statuses.
- When not even one monitored device is registered, “The monitoring devices have not been registered” will be displayed.
Traffic information
The physical interface traffic is displayed on a graph.
There are different gadgets for the transmission traffic and for the reception traffic.
- Use the [Live], [Day], [Month], and [Year] buttons to change the graph rendered.
- [Live]
- Traffic can be viewed for the previous two minutes.
- The graph will be automatically refreshed each second.
- [Day]
- Displays traffic per hour for the specified date.
- The day can be set using the day specification box at the top right of the gadget.
- Press the date specification box to display the calendar, and select the day to show the graph for the day specified.
- A date within one year to the past can be set using the calendar.
- [Month]
- Displays traffic per day for the specified month.
- The month can be set using the month specification box at the top right of the gadget.
- Press the month specification box to display the calendar, and select the month to show the graph for the day specified.
- A past month within one year can be set using the calendar.
- [Year]
- Displays traffic per month for the specified year.
- The year can be set using the year specification box at the top right of the gadget.
- Press the year specification box to display the calendar, and select the year to show the graph for the year specified.
- The year specification box can be used to specify either the current year or the previous year.
- [Live]
- Press the “Interface selection” button (
- Select the interface to display on the graph, from the “Interface selection” dialog box.
- The average traffic per hour for the interface is rendered on the graph.
- Up to 8 lines can be displayed on the graph using the colors blue, salmon pink, yellow, green, gray, sky blue, pink and purple for a total of 8 colors.
- These colors are allocated in the order that they are rendered on the graph, from the newest interface numbers onwards.
- The Y-axis upper limit grows with the traffic, from a minimum of 10 [Mbps] to a maximum of 10000 [Mbps].
- The information shown below is shown on the graph for the specified period that is rendered.
- Live : Current time - time 120 sec. ago (hh:mm:ss format)
- Day : 0 o’clock - 23 o’clock
- Month : 1st - 28th, 29th, 30th, 31st
- Year : Jan - Dec
- Point the mouse cursor above a line on the graph to show the interface information, date and traffic amount.
- A legend for the currently displayed graph is shown at the lowermost part of the gadget.
- Using the legend
- Only the lines on the graph that are enabled using the check boxes in the legend will be displayed.
- Deselecting the check boxes will hide the corresponding lines from the graph.
- This is useful when multiple lines are overlapping or when you wish to temporarily monitor a specific interface only.
- If the interface you are currently monitoring does not exist, the message “The currently monitored interface is not selected” will display.
- Refresh the screen to restore the rendered time period and the selections on the legend to their defaults, as shown below.
- Rendered period : Live
- Legend check boxes : All applied
- If the traffic exceeds 60%, a warning (
- If the traffic falls below 50%, the warning will be cancelled.
- When displaying a gadget in a separate window using the “Separate” button (
- The settings prior to being separated will be reflected in the settings for the interface currently being monitored.
- The rendered time period and the selections on the legend return to their defaults.
- The settings for the interface selected in a separated window will be reflected in the dashboard gadget when the separated screen is closed.
- When directly inputting the URL for a separated window and displaying a gadget
- The rendered time period and the selections on the legend return to their defaults.
Resource information(Graph)
This shows the CPU usage and memory usage in graph format.
- Use the [Live], [Day], [Month], and [Year] buttons to change the graph rendered.
- [Live]
- Traffic can be viewed for the previous two minutes.
- The graph will be automatically refreshed each second.
- [Day]
- Displays traffic per hour for the specified date.
- The day can be set using the day specification box at the top right of the gadget.
- Press the date specification box to display the calendar, and select the day to show the graph for the day specified.
- A date within one year to the past can be set using the calendar.
- [Month]
- Displays traffic per day for the specified month.
- The month can be set using the month specification box at the top right of the gadget.
- Press the month specification box to display the calendar, and select the month to show the graph for the day specified.
- A past month within one year can be set using the calendar.
- [Year]
- Displays traffic per month for the specified year.
- The year can be set using the year specification box at the top right of the gadget.
- Press the year specification box to display the calendar, and select the year to show the graph for the year specified.
- The year specification box can be used to specify either the current year or the previous year.
- [Live]
- The average usage ratio is rendered per hour for the monitored period.
- The CPU usage is shown on the graph using blue lines, and the memory usage is shown using salmon pink lines.
- The upper limit for the graph’s Y axis is 100 [%].
- The information shown below is shown on the graph for the specified period that is rendered.
- Live : Current time - time 120 sec. ago (hh:mm:ss format)
- Day : 0 o’clock - 23 o’clock
- Month : 1st - 28th, 29th, 30th, 31st
- Year : Jan - Dec
- Point the mouse cursor above a line on the graph to show the monitored period, date and time and usage ratio.
- A legend for the currently displayed graph is shown at the lowermost part of the gadget.
- Using the legend
- Only the lines on the graph that are enabled using the check boxes in the legend will be displayed.
- Deselecting the check boxes will hide the corresponding lines from the graph.
- Refresh the screen to restore the rendered time period and the selections on the legend to their defaults, as shown below.
- Rendered period : Live
- Legend check boxes : All applied
- If the CPU usage exceeds 80%, a warning (
- If the CPU usage falls below 80%, the warning will be cancelled.
- If the memory usage exceeds 80%, a warning (
- If the memory usage falls below 80%, the warning will be cancelled.
- When displaying a gadget in a separate window using the “Separate” button (
- The rendered time period and the selections on the legend return to their defaults.
- When directly inputting the URL for a separated window and displaying a gadget
- The rendered time period and the selections on the legend return to their defaults.
Stack information
The following information is displayed.
- Stack function
- Displays whether the stack function is enabled.
- Members
- Displays the stack member types and roles.
- Status
- Displays the stack member status.
- Only displayed when the stack function is enabled.
- SWR2310 Series Technical Data (GUI)
- LAN map
- About the LAN map
About the LAN map
1. Summary
The LAN map shows terminal information for the slave devices (Yamaha switches) that are connected to the network, providing a visualization of the entire network. You can use the GUI to view the slave status and make VLAN settings. You can also detect network problems to gather information when troubleshooting a problem.
* The switch that controls the LAN map (this unit) is called the “master,” and the Yamaha switches that are controlled by the master are called “slaves.”
2. Using the LAN map
Here we explain how to use the LAN map.
2-1. About the buttons
You can save the current slave and terminal connection status as a snapshot. You can also export, import, or delete snapshots.
*In order to use the snapshot function, you must enable the snapshot function from
*Depending on the network structure, it may take several minutes for saving to be completed. During this time, other processing can still be executed.
Messages for the current network are displayed. This notifies you of slave problems such as a stopped fan or a loop that has occurred.
This displays the history of notification messages. The history can save up to 1000 items.
The “Device list page” is shown in a separate window. In the device list page you can view a list of the terminals and slaves managed in the LAN map, and manage terminal information.
The “Whole map page” is shown in a separate window. On the whole map page, the devices connected to the LAN are displayed on the same map.
Here you can make settings for the LAN map function.
 “History” button
 “Device list” button
 “Whole map” button
2-2. Using the LAN map
To use the LAN map, open the “LAN map settings” dialog box from the “Settings” button, and select the “Master” check box in the basic settings under “L2MS operation mode”.
If “L2MS operation mode” is set to “Slave” or “Do not use”, you cannot use the LAN map for this unit. If this unit is operating as a slave, use the LAN map on the master that is controlling this unit.
2-3. Change pages
The LAN map consists mainly of map, tag VLAN, and multiple VLAN pages.
To switch the page that is displayed, use the page selection toggle switch located in the upper part of the screen.
2-4. Use the snapshot function
The snapshot function compares the current network connection state to the previously saved network connection state (snapshot), and if a change is detected, displays a warning message. To use the snapshot function, perform the following operations.
Use the
Use the
3. Differences in what administrative users and general users can do
Basically, a general user can only view information, and cannot perform operations that modify settings, manage snapshots, edit or operate the terminal master and so on. An administrative user can perform all operations.
The following operations cannot be performed by a general user.
Slave management
Editing, deleting, newly registering, importing, and exporting a terminal master
Procedure for saving a terminal list and slave list in CSV format
Map
1. Summary
This visualizes the network status. You can check the connection status of the devices, and change the settings of a Yamaha switch.
2. Structure of the map page
The map page provides a “Tree view,” “Device detail and settings view,” and “Connected devices view” to show the state of the network.
2-1. Tree view
The slave topology starting at the master is shown in the lower left of the screen. Network devices of other manufacturers are not shown. In the “Tree view,” press the “Devices” icon to see device information in the “Device details and settings view” and “Connected devices view.”
2-2. Device details and settings view
Detailed information and device detail images for the master or slave selected in the “Tree view” are shown in the upper part of the screen.
2-3. Connected devices view
Devices that are connected to the master or slave selected in the “Tree view” are shown in the lower right of the screen. If “Device management” is not enabled in “LAN map settings,” equipment information (e.g., PC or mobile devices) is not shown.
- Acquisition date and time
This is the time at which information was last obtained for equipment that is connected to the master or slave selected in the “Tree view.” This is not shown if “Device management” is not enabled in “LAN map settings.”
This obtains information for terminal that is connected to the master or slave selected in the “Tree view.” This is not shown if “Device management” is not enabled in “LAN map settings.”
- Select page
Page numbers are shown for the list of currently-displayed terminal. Press
All items of device information are shown in the list. While all are displayed, press this again to return to the previous display.
- List
Information is listed for equipment that is connected to the master or slave selected in the “Tree view.” You can press each item’s
The VLAN ID item shows (A) for an access VLAN or (T) for a trunk VLAN.
If the port is being used as a port for a private VLAN, the VLAN ID is not shown, and (P) is shown.
If the port is being used as a port for a voice VLAN, the VLAN ID is not shown, and (V) is shown.
3. Checking the status of devices
In “Device details and settings view” you can view detailed device information such as device name and MAC address, and also check the port link status, power supply status.
- Device name
- MAC address
- Port link status
- Power supply status
Constraints: For devices in a stack configuration, you will only be able to check the status for stack ID 1.
3-1. Checking the link status of ports
In “Device details and settings view,” you can use the “Port” icon display to check the link status of the port.
If a slave is selected in the “Tree view,” you can press the “Port” icon in the “Device details and settings view” to see detailed port information. If a “Port” icon shows an ↑, this indicates that the port is an uplink port.
The “Port” icon is shown as follows depending on the link status.
For a LAN port
| Icon | Explanation |
|---|---|
 | Link up (port speed 1000BASE-T) |
 | Link up (port speed 100BASE-TX) |
 | Link up (port speed 10BASE-T) |
 | Error occurrence |
 | Link down |
For an SFP port
| Icon | Explanation |
|---|---|
 | Link up (port speed 10GbE) |
 | Link up (port speed 1GbE) |
 | Stack Port |
 | Error occurrence |
 | Link down |
3-2. Checking the power supply status of a switch that supports PoE
In the “Tree view,” press the “Device” icon of a switch that supports PoE, and in “Device details and settings view,” press the [Power supply status] button to check the PoE power supply status.
The “Port” icon is shown as follows depending on the power supply status.
For the SWR2311P Series
| Icon | Explanation |
|---|---|
 | PoE is being supplied (supply Class0-3) Note: On the SWR2311P Series the power supply class in indicated in the icon. |
 | PoE is being supplied (supply Class4) |
 | PoE is not being supplied |
| Power supply stopped (error occurred) |
| Power supply stopped |
For the SWR2100P series
| Icon | Explanation |
|---|---|
| PoE is being supplied (supply Class0-4) |
| PoE is not being supplied |
| Power supply stopped (error occurred) |
| Power supply stopped |
4. Monitoring network errors
The LAN map monitors the network and notifies you of errors. If an error is detected on the network, a message is displayed below.
- Notification area
Press the
- History area
Constraints: For devices in a stack configuration, you will only be able to detect errors for stack ID 1.
4-1. Monitoring the operating status and errors of a switch
In the LAN map, when the following operations or error are detected, a message is displayed in the “Notification area” or “History area.” Some messages are displayed in both the “Notification area” and the “History area,” and some are displayed in only one.
| Troubleshooting items | Notification area | History area |
|---|---|---|
| The fan of a Yamaha switch is stopped | ✓ | ✓ |
| The fan speed of the Yamaha switch has increased | ✓ | ✓ |
| The fan speed of the Yamaha switch has decreased | - | ✓ |
| The power supply voltage of the Yamaha switch has exceeded the upper threshold | ✓ | ✓ |
| A line surge has occurred in the power supply of the Yamaha switch | ✓ | ✓ |
| The temperature ( CPU, PHY, SFP module, Unit, PSE ) of the Yamaha switch has exceeded the upper threshold | ✓ | ✓ |
| The temperature of the Yamaha switch has returned to normal | - | ✓ |
| A loop is occurring at ports of a Yamaha switch | ✓ | ✓ |
| Optical Rx level of the SFP port of the Yamaha switch has reached an abnormal level | ✓ | ✓ |
| Optical Rx level of the SFP port of the Yamaha switch has returned to normal level | - | ✓ |
| Transmission queue usage ratio for the port on the Yamaha switch is high | ✓ | ✓ |
| Transmission queue usage ratio for the port on the Yamaha switch has returned to normal | - | ✓ |
| The power being supplied from the Yamaha switch has entered the guard band range | - | ✓ |
| Power is no longer supplied from a port of a Yamaha switch | - | ✓ |
| Power has begun being supplied from the port of a Yamaha switch (for each Supply Class). | - | ✓ |
| Power supplied from a port of a Yamaha switch has halted abnormally | ✓ | ✓ |
| The power being supplied from a Yamaha switch has exceeded the maximum power supply capacity | ✓ | ✓ |
| An error occurred in the power supply of a Yamaha switch | ✓ | ✓ |
| The monitoring device is DOWN | ✓ | ✓ |
| The monitoring device is UP | - | ✓ |
Enable the event monitor function on “LAN map settings” to periodically acquire the current status of the monitoring target event (event information) for the slave.
The monitoring target events and compatible slaves are as follows.
| Monitoring target event | Compatible models |
|---|---|
| Changes in optical Rx level of the SFP port | SWP1 series, SWP2 series, SWR2310 series, SWR2311P-10G |
| Changes in usage ratio for the port transmission queue | |
| Status notification for device monitoring | |
| Changes in temperature and FAN speed | SWR2311P-10G |
Normally, since a notification is sent to the master whenever an event occurs on a slave, the slave event that occurs will be detected even if the event monitoring function is disabled. However, we recommend that the event monitoring function be enabled, in case the master cannot receive the notification for some reason.
4-2. Monitoring the network connection status
In order to monitor the network connection status, enable the snapshot function using the procedure described “About the LAN map”-“2-4. Using the snapshot function” in this help.
The snapshot function compares the current network status with the snapshot, and if there is a difference, determines that a network error has been detected. When you press the “Snapshot” button, the snapshot management dialog box appears, allowing you to save, export, import, or delete snapshots.
- Save
Save a snapshot. If “Update network connection status before saving” is enabled, the network connection status information is updated before saving.
- Export
The slave snapshot and terminal snapshot are downloaded.
- Import
A snapshot saved on the PC is applied to the master. Use the “File select” button to select a slave snapshot and a terminal snapshot. If you don’t select a terminal snapshot, the existing snapshot is deleted, and an empty terminal snapshot is created.
*If you use an edited snapshot, it might not work correctly.
- Delete
Delete a snapshot.
If the snapshot function is enabled, the slave is always the object of warnings, but the terminal is the object of warnings if all of the following conditions are fulfilled.
- The snapshot function’s “Include terminals in comparison” is enabled
- The snapshot function is set to “Include in monitoring” on the terminal master
If you want all terminals on the network to be excluded from warnings, disable the snapshot function’s “Include terminals in comparison”. If you want only a specific terminal to be excluded from warnings, enable the snapshot function’s “Include terminals in comparison,” and edit the terminal master settings so that the snapshot function of the terminal to be excluded from warnings is set to “Don’t include in monitoring”. In the case of a terminal that is excluded from warnings, it will not be determined that a network error has been detected even if there is a difference between the connection status and the snapshot.
The snapshot function allows you to check the following operating status and errors. Some messages are displayed in both the “Notification area” and the “History area,” and some are displayed in only one.
| Troubleshooting items | Notification area | History area |
|---|---|---|
| An unregistered slave and terminal are connected | ✓ | ✓ |
| There is a slave and terminal whose connection ports differ | ✓ | ✓ |
| There is a slave and terminal that cannot be found | ✓ | ✓ |
| There is a discrepancy between the states of the slave and terminal | - | ✓ |
| A snapshot has not been created | ✓ | - |
| Creation of a snapshot has started | - | ✓ |
| Creation of a snapshot has finished | - | ✓ |
| A snapshot is being created | ✓ | - |
| Creation of a snapshot was interrupted | - | ✓ |
| Creation of a snapshot failed | - | ✓ |
5. Searching for a device
To search for a device, input the keywords in the search box and press the “Search” button. All devices whose information matches the keywords will be shown in “Connected devices view”. The “Device” icon for connected devices matching the keywords inputted in the tree view will be highlighted in blue-gray.
To cancel the search, press the [X] button.
Devices are searched by comparing the keywords with the following device information.
- Route
- SSID
- VLAN ID
- Manufacturer
- Device name
- Comment
- MAC address
- IP address
- Model name
- OS
- Frequency
Pressing the “Device” icon highlighted blue-gray in the tree view will highlight the devices found in the search performed in “Connected devices view” in blue-gray. When the search results overlap with the red highlights due to error detection, blue-gray-colored results will be given priority. Lowercase and capital letters are treated the same for keywords.
You can use regular expressions in keywords. Below is an example of regular expressions you can use in the LAN map.
| Syntax | Explanation |
|---|---|
| A | The character “A” |
| ABC | The characters “ABC” |
| [ABC] | One character, either “A”, “B” or “C” |
| [A-C] | One character between “A” and “C” |
| [^ABC] | An arbitrary character that is neither “A”, “B” or “C” |
| . | An arbitrary character |
| A+ | At least one “A” character |
| A* | At least zero “A” characters |
| A? | Zero or one “A” character |
| ^A | A string that begins with “A” |
| A$ | A string that ends with “A” |
| ABC|DEF|GHI | “ABC”, “DEF” or “GHI” |
| A{2} | Two “A” characters (AA) |
| A{2,} | Two or more “A” characters (AA, AAA, AAAA...) |
| A{2,3} | Two to three “A” characters (AA, AAA) |
| \b | Word breaks, such as spaces |
| \B | Any character besides \b |
| \d | An arbitrary number (same as [0-9]) |
| \D | Any character besides numbers (same as [^0-9]) |
| \s | Single breaking character |
| \S | Any single character besides \s |
| \w | Alphanumeric characters including underlines (same as [A-Za-z0-9_]) |
| \W | Any character besides \w |
6. Setting and managing slaves
You can set and manage slaves using the buttons that are shown in “Device details and settings view.” The buttons shown in “Device details and settings view” will differ depending on the device that is selected in “Tree view.”
6-1. Managing slaves
If in “Tree view” you press the master’s “Device” icon, and in “Device details and settings view” press the [Manage slaves] button, the slave management settings dialog box appears, allowing you to view information for each device and set the IP address.
The items that can be set and managed for each device are the following.
Note: The following settings can be made on the SWP2 Series, the SWP1 Series, the SWR2310 Series, the SWR2311P Series.
- IP Address Settings
This configures the IP address.
The IP address displayed are slaves at the time that the screen is displayed.
The IP address prior to making the settings may be shown, depending on the timing.
- CONFIG Save/Restore/Delete
Saves, restores or deletes the configuration.
This can be used for bulk operations on multiple slaves as well.
- Specification method
This sets the method of specifying the switch.
6-2. Setting and maintaining switches
In the “Tree view,” press the “Device” icon of the Yamaha switch, and in the “Device details and settings view,” press the button (the name depends on the switch) to see a dialog box or setting screen.
Here you can make settings for the various functions of the switch, and perform maintenance such as updating the firmware or restarting. The items that can be set or viewed, and the maintenance functions that can be executed, will differ depending on the model.
【 For the SWR2311P-10G, SWP1, SWP2, and SWR2310 Series 】
When you press the [Open the GUI] button, the web setting screen of the switch opens in another window.
【 For the SWR2100P Series 】
Press the [Switch settings view and maintenance] button to open the dialog box.
- Device name
Display the device name of the switch.
- Port common settings
Display common settings for the ports.
- Maintenance
The following can be executed for a switch.
- Reset the frame counter
- Update firmware
- Restart
6-3. Making port settings for a switch
In the “Tree view,” press the “Device” icon of a Yamaha switch, and in the detailed image of a device in “Device details and settings view,” select a port and press the [Port settings] button to display the port settings dialog box. If a port is not selected in the detailed image of the device in “Device details and settings view,” it is not possible to make port settings. Port settings are possible only for a smart L2 switch.
6-4. Performing power supply operations for the switch port
In the tree view, press the “Device” icon corresponding to the Yamaha switch; and on the detailed image of the device in “Device details and settings view,” select a port and press the [Port power supply operations] button to display the port power supply settings dialog box. If a port is not selected in the detailed image of the device in “Device details and settings view,” and the selected port does not support power supply, you will not be able to perform power supply operations with this port. Power supply settings can be configured for each port from the port power supply operation dialog.
This can be set only on the SWR2100P Series, and the SWR2311P Series.
6-5. Configuring the link aggregation settings
In the tree view, press the “Device” icon corresponding to the Yamaha switch; and press the [Link aggregation settings] button in “Device details and settings view” to display the link aggregation settings dialog box. This lets you configure settings regarding link aggregation, add a logical interface or configure the VLAN settings and so on.
Tag VLAN
1. Summary
You can create VLANs to organize Yamaha switches into groups.
Tagged VLANs can be set for the following slaves.
- Yamaha network switch
- SWP2-10SMF, SWP2-10MMF
- SWP1-16MMF, SWP1-8MMF, SWP1-8
- SWR2311P-10G
- SWR2310-10G, SWR2310-18GT, SWR2310-28GT
2. Notes
- If a switch of a different manufacturer is connected below a master, the master will be unable to recognize the corresponding device, and the topology will therefore not be displayed. If communication from the terminal becomes impossible even though the tag VLAN settings are correct, it might be that a switch made by another manufacturer which is blocking VLAN tagged frames is connected below the master.
- If a Yamaha switch of a model that cannot be determined is connected below the master, it might be that the VLAN tagged frames cannot pass through that device, depending on the settings of that device.
- Configurations that include MST instances in the spanning tree are not supported.
3. Tag VLAN page structure
3-1. Button
Create a new VLAN group.
In order to join a port to a VLAN group, the VLAN group must first be created.
Obtain topology information and VLAN settings information, and redraw the tag VLAN group list and the topology.
Depending on the number of slave units, it may take several seconds to several tens of seconds for the slave VLAN settings information to be reflected.
3-2. Tag VLAN group list
Display the list of VLAN groups that are registered to the master, and the list of VLAN groups that the slave ports have joined.
However, the list does not show private VLANs or VLAN groups for which frame forwarding is disabled.
The port color is assigned to each VLAN group.
3-3. Topology
The topology starting at the master is shown in the lower part of the screen.
By noting the color of the port, you can determine the VLAN group to which it is joined.
Constraints: For devices in a stack configuration, you will only be able to render for stack ID 1.
4. Make tag VLAN group settings
4-1. Create new
To create a new VLAN group, press the 
The following settings can be made.
| Item name | Explanation |
|---|---|
| VLAN-ID | Set the ID of the VLAN. |
| Name | You can assign a name to the VLAN ID. |
After input, press the [Confirm] button to register the VLAN group.
4-2.Change settings
If you want to change the VLAN group settings, press the [Setting] button located in the column at the right of the “Tag VLAN group list”.
You can edit the name setting.
4-3.Register
If a slave port is joined to a VLAN group that is not registered to a master, it is shown as an “Unknown” VLAN group in “Tag VLAN group list”.
By pressing the [Register] button located in the column at the right of “Tag VLAN group list”, you can register a VLAN group to a master.
4-4. Delete
If you want to delete a VLAN group, press the [Delete] button located in the column at the right of the “Tag VLAN group list”.
Then press the [Confirm] button to delete the settings of the specified VLAN group and also delete the settings of the VLAN group that is applied to the slave.
5. Join a tag VLAN group
To select a slave port within the topology, press the [Select joined port] button button in the right column of “Tag VLAN group list”.
The color of the port indicates the setting status of the VLAN group.
The following is a depiction of when the port color is set to 
| LAN | SFP | Explanation |
|---|---|---|
|  | This is an access port that is joined to the specified VLAN group. |
| | This is an access port that is joined to the default VLAN group. |
 |  | This is an access port that is joined to the specified VLAN group. To determine the joined VLAN group, note the color of the port that is assigned in “Tag VLAN group list”. |
 |  | This is a trunk port or hybrid port. This is joined to the specified VLAN group. |
 |  | This is a trunk port or hybrid port. This is not joined to the specified VLAN group. |
When you select a port, the color of the port changes, allowing you to join it to the specified VLAN group.
By re-selecting a port, you can un-join it.
When operating the VLAN join status of the port that belongs to the logical interface, the same settings will be applied to all ports belonging to the same logical interface.
After selecting a port, press the [Confirm] button to apply the setting.
* If a Yamaha switch of a model that cannot be determined is connected, it might be that the VLAN tagged frames cannot pass through that device, depending on the settings of that device.
- Automatically joining uplink ports and downlink ports
If you join a port to a VLAN group, the port that connects from the master to the corresponding slave (uplink/downlink) will automatically be either a trunk port or a hybrid port.
- Constraints when joining a VLAN group
The following constraints apply when making SWP1 Series, SWP2 Series, SWR2310 Series, SWR2311P Series settings.
- If the specified VLAN group is used as a private VLAN by a slave, a port of the corresponding slave cannot be joined to the specified VLAN group.
- If a port is specified as a private VLAN’s promiscuous port, or as a host port, settings for that port cannot be made.
- If a port is used by the link aggregation function, settings for that port cannot be made.(only SWP1 Series)
Also, you cannot change the stack port settings for devices in a stack configuration.
6. Show tag VLAN group settings
In “Tag VLAN group list”, colors are assigned to the ports for each VLAN group.
By noting the color of a slave port in the topology, you can see the VLAN group to which it is joined.
Examples are shown below.
| LAN | SFP | Explanation |
|---|---|---|
| | This is an access port that is joined to a VLAN group other than the default VLAN. To determine the joined VLAN group, note the color of the port that is assigned in “Tag VLAN group list”. |
 |  | This is a trunk port or hybrid port. |
| | This is an access port that is joined to the default VLAN group. |
You can also check the tag VLAN group settings from the tool tip that appears when you mouse-over.
The items shown in the tool tip are as follows.
- Port number
- For logical interfaces, the logical interface name and the numbers of all ports belonging to the logical interface will be shown.
- saX is the name of the logical interface for a static link aggregation.
- poX is the name of the LACP virtual interface.
- Port type ( Access, Trunk, Hybrid )
- VLAN group joined
Supplementary information related to SWP1 Series, SWP2 Series, SWR2310 Series, SWR2311P Series settings is shown below.
- About native VLAN
The uplink/downlink ports are the trunk ports, and the default VLAN is specified as the native VLAN. If the frame received by the trunk port is untagged, the native VLAN is the VLAN group joined by untagged frames.
- About promiscuous ports and host ports of a private VLAN
If the port is specified as a private VLAN’s promiscuous port or a host port, the port type in the tool tip is shown as “Private,” and the joined VLAN group is not shown.
- SWR2310 Series Technical Data (GUI)
- LAN map
- Details
- Multiple VLAN
Multiple VLAN
1. Summary
You can divide the ports of a single switch into multiple groups, and block communication between groups. In addition to grouping ports into multiple groups, a single port can also be joined to multiple groups. For example, a port that is connected to a terminal that must communicate with all groups, such as a server or router, would be joined to each and every group.
For multiple VLANs, the same IP address is assigned even if the group is different.
The slaves for which a multiple VLAN can be set, as well as the maximum number of groups that can be set for each slave on this page are shown below.
| Supported slaves | Maximum number of groups |
|---|---|
| SWP2-10SMF SWP2-10MMF | 256 |
| SWR2311P-10G | 256 |
| SWR2310-28GT SWR2310-18GT SWR2310-10G | 256 |
2. Multiple VLAN page structure
The multiple VLAN page consists of three views: tree view, multiple VLAN settings view, and connected devices view.
2-1. Tree view
These are the same as shown in the map.
The slave topology starting at the master is shown in the lower left of the screen. Network devices of other manufacturers are not shown. In the “Tree view,” press the “Devices” icon to see device information in the “Connected devices view”. If a slave that supports multiple VLANs is selected, settings are shown in “Multiple VLAN settings view”.
2-2. Multiple VLAN settings view
The multiple VLAN settings of the slave selected in “Tree view” are shown. This is not shown if a master or slave that does not support multiple VLANs is selected in “Tree view”.
Constraints: For devices in a stack configuration, you will only be able to render for stack ID 1.
- List of multiple VLAN group settings
The status of the joined ports for each group of the multiple VLAN are shown in the form of a table. The horizontal direction of the table shows the ports, and the vertical direction shows the groups.
In the table, you can press the
Pressing the [Port number] button in the upper edge of the table will select the ports of all groups in the Port column, and pressing the [Group number] button in the left edge of the table will select all ports in the Group line. By pressing the “↘” button in the upper left of the table, you can select diagonally staggered ports from the upper left.
Ports that are not disabled will not be changed status by any specify method.
All ports that belong to the logical interface will be shown together, as displayed on the right side of the table.The logical interface type and number will be shown as a two-row label above the port numbers.
The logical interface type (sa or po) is shown on the upper row, and the interface number is shown on the bottom row.
Static link aggregation is shown for “sa”, and LACP link aggregation is shown for “po”.
When operating the group join status of the ports that belong to the logical interface, the same settings will be applied to all ports belonging to the same logical interface.
- Ports/groups to display
Move the slider on the bar to change the ports and groups shown on the screen.
The upper bar is for ports, and the lower bar is for groups.
The left-hand slider changes the minimum value, and the right-hand slider changes the maximum value.
- Minimized view
Select the check box to display a minimized view of the port and group icons.
When using the minimized view, the arrows for port uplinks and downlinks will not be displayed.
- [Return all groups to the state prior to the change] button
Return the ports joined to the multiple VLAN to the state prior to the change.
- [OK] button
Apply the settings of the ports joined to the multiple VLAN.
These settings will also apply to ports that are hidden.
The “Multiple VLAN group setting list” can be switched between displayed and hidden by pressing the
- Ports/groups to display
 ). If you once again press a port icon that is in the joined state, it returns to the non-joined state.
 button in the upper left.
The contents of the settings for a previously-specified multiple VLAN group are shown by the switch graphic in the lower part of “Multiple VLAN settings view”.
- Group select pulldown menu
Select the multiple VLAN group that is shown by the switch image at the right side.
- Switch image
Ports that are joined to the group currently selected in the group select pulldown menu are shown.
2-3. Connected devices view
These are the same as shown in the map.
Devices that are connected to the master or slave selected in the “Tree view” are shown in the lower right of the screen. If “Device management” is not enabled in “LAN map settings,” terminal information (e.g., PC or mobile devices) is not shown.
If a switch is selected as a slave, you can check the type of device that is connected to each port of the switch, and use this as a reference when making multiple VLAN group settings.
- Acquisition date
This is the time at which information was last obtained for equipment that is connected to the master or slave selected in the “Tree view”. This is not shown if “Device management” is not enabled in “LAN map settings”.
- Select page
Page numbers are shown for the list of currently-displayed terminals. Press
This obtains information for terminals that are connected to the master or slave selected in the “Tree view”. This is not shown if “Device management” is not enabled in “LAN map settings”.
- List
Information is listed for equipment that is connected to the master or slave selected in the “Tree view”. You can press each item’s
The VLAN ID item shows (A) for an access VLAN or (T) for a trunk VLAN.
If the port is being used as a port for a private VLAN, the VLAN ID is not shown, and (P) is shown.
If the port is being used as a port for a voice VLAN, the VLAN ID is not shown, and (V) is shown.
3. Making settings for multiple VLAN groups
To make multiple VLAN group settings, first select the switch that you want to set from the “Tree view”. When you make a selection, the “Multiple VLAN group settings list” appears in the “Multiple VLAN settings view”.
When the “Multiple VLAN group settings list” appears, select the ports that you want to join to each group by pressing the corresponding Port icon. When making settings, refer to the following tips.
When you finish selecting the ports to join, press the [OK] button to apply the settings to the switch and complete the settings.
Tips when selecting multiple VLAN settings
- You want to select ports efficiently
By using the [Port number] button in conjunction with the “↘” button you can select ports efficiently.
You can use the [Port number] button to allow a specific port to communicate with all other ports. For example, the uplink port normally needs to be able to communicate with all other ports, so it is joined to all groups; by pressing the [Port number] button in the column of the uplink port, you can avoid the trouble of selecting them individually.
Use the “↘” button when you want to join each port to a different group. For example, if you want to block all communication between each downlink port, and allow communication only with the uplink port, press the [Port number] button and “↘” button in the uplink port column; each group is joined to the uplink port and to one downlink port, allowing you to easily obtain the desired settings. Such settings are often used for a network in an Internet-equipped apartment building.
- When you want to restrict the ports and groups to configure
Adjust the bars for the “Ports/groups to display” to show only the ports and groups that you need.
- You want to re-do the settings
By pressing the [Return all groups to the state prior to change] button you can return the joined port selection state to the state prior to change.
4. Showing settings for multiple VLAN groups
Multiple VLAN groups that have already been specified are indicated by the switch graphic that is shown at the bottom of the “Multiple VLAN settings view”. From the pulldown at the left, select the group that you want to check; the ports that are joined to that group change to the color corresponding to the group.
The contents of the settings shown here are the settings that have been actually applied to the switch by pressing the [OK] button. The content that is currently being edited in the “Multiple VLAN group settings list” is not reflected in the display.
Device list
1. Summary
In the device list you can view a list of the terminals and slaves managed in the LAN map, and use the terminal master to centrally manage terminal information.
2. Terminal list
The terminal list page is explained here.
2-1. Summary
The terminal list page shows a list of the terminals that are managed by the LAN map. You can use the list to check the time that a terminal was detected or the time that it was lost. You can also edit terminal information in the list, or register it to the terminal master.
2-2. About the buttons
Delete information of the selected lost terminal from the terminal list.
Refresh the terminal list page.
- [Save as CSV] button
Save the terminal list as a CSV file.
- [Edit] button
Edit terminal information. Edited information is registered in the terminal master.
2-3. Checking terminal information
In the list you can check the terminal information that is managed by the LAN map. You can press each item’s Sort switch to sort the list. The initial screen is sorted in order of route. Lost terminals are shown highlighted in gray.
The VLAN ID item shows (A) for an access VLAN or (T) for a trunk VLAN.
If the port is being used as a port for a private VLAN, the VLAN ID is not shown, and (P) is shown.
If the port is being used as a port for a voice VLAN, the VLAN ID is not shown, and (V) is shown.
2-4. Editing terminal information and registering it to the terminal master
You can edit the information for the terminals that are managed by the LAN map. Edited information is registered in the terminal master. Press the [Edit] button of the terminal information that you want to edit, and then edit the information. You can edit the following items.
Type
Select the type from the selection menu.
* This is shown as an icon in the map page and multiple VLAN page “Connected device view”.
Manufacturer
Enter the manufacturer name.
Enter up to 128 single-byte alphanumeric characters or single-byte symbols.
Model name
Enter the model name.
Enter up to 128 single-byte alphanumeric characters or single-byte symbols.
Device name
Enter the device name.
Enter up to 128 single-byte alphanumeric characters or single-byte symbols.
OS
Enter the OS name.
Enter up to 128 single-byte alphanumeric characters or single-byte symbols.
Comment
Enter up to 128 single-byte alphanumeric characters or single-byte symbols.
Snapshot
Select whether the terminal is or is not included in monitoring for the snapshot function.
* Terminal information that has been registered can also be edited from the terminal master page.
Note: When inputting “"” or “,” for parameters where text is inputted, the maximum number of allowable characters will be less than 128.
2-5. Deleting a lost terminal
You can delete information of a lost terminal from the terminal list. Select the lost terminal information that you want to delete, and press the “Delete” button. The lost terminal information that you selected is deleted.
2-6. Saving a list to a CSV file
You can save the terminal list as a CSV file. Press the [Save as CSV] button. The terminal list is saved as a CSV file.
3. Terminal master
The terminal master page is explained here.
3-1. Summary
The terminal master page shows a list of the terminals that are registered in the terminal master. You can newly register, edit, or delete terminal information, and import or export terminal master settings.
3-2. About the buttons
Delete the selected terminal information from the terminal master.
Newly register terminal information in the terminal master.
Refresh the terminal master page display.
Apply the terminal master saved on the PC to the master.
Save the terminal master as a CSV file.
- [Edit] button
You can edit the terminal information that has been registered in the terminal master.
3-3. Checking terminal information
You can identify the terminal master in the list. You can press each item’s Sort switch to sort the list. The initial screen is sorted in order of MAC address.
3-4. Registering new terminal information
You can newly register terminal information in the terminal master. Press the “Register new” button, and enter the content to be registered. You can register the following items.
MAC address
Enter the MAC address of the terminal.
Enter single-byte characters delimited by a “:” (example: 00:a0:de:00:00:00).
Type
Select the type from the selection menu.
* This is shown as an icon in the map page and multiple VLAN page “Connected device view”.
Manufacturer
Enter the manufacturer name.
Enter up to 128 single-byte alphanumeric characters or single-byte symbols.
Model name
Enter the model name.
Enter up to 128 single-byte alphanumeric characters or single-byte symbols.
Device name
Enter the device name.
Enter up to 128 single-byte alphanumeric characters or single-byte symbols.
OS
Enter the OS name.
Enter up to 128 single-byte alphanumeric characters or single-byte symbols.
Comment
Enter up to 128 single-byte alphanumeric characters or single-byte symbols.
Snapshot
Select whether the terminal is or is not included in monitoring for the snapshot function.
3-5. Editing terminal information
You can edit the terminal information that has been registered in the terminal master. Press the [Edit] button of the terminal information that you want to edit, and then edit the information. You can edit the following items.
Type
Select the type from the selection menu.
* This is shown as an icon in the map page and multiple VLAN page “Connected device view”.
Manufacturer
Enter the manufacturer name.
Enter up to 128 single-byte alphanumeric characters or single-byte symbols.
Model name
Enter the model name.
Enter up to 128 single-byte alphanumeric characters or single-byte symbols.
Device name
Enter the device name.
Enter up to 128 single-byte alphanumeric characters or single-byte symbols.
OS
Enter the OS name.
Enter up to 128 single-byte alphanumeric characters or single-byte symbols.
Comment
Snapshot
Select whether the terminal is or is not included in monitoring for the snapshot function.
3-6. Deleting terminal information
You can delete the selected terminal information from the terminal master. Select the terminal that you want to delete, and press the “Delete” button. The selected terminal information is deleted.
3-7. Importing a terminal master
Apply the terminal master saved on the PC to the master. Press the “Import” button, and use the [File select] button to select the terminal master. The selected terminal master is applied to the master.
When directly editing the terminal master, use no more than 128 single-byte alphanumeric or symbol characters for each item.
A character string that includes multi-byte characters is detected as an empty character string, and a character string that exceeds 128 characters is truncated at 128 characters.
3-8. Exporting a terminal master
You can save the terminal master as a CSV file. Press the “Export” button. The terminal master is saved as a CSV file.
4. Slave list
The slave list page is explained here.
4-1. Summary
The slave list page shows a list of the slaves that are managed by the LAN map. You can use the list to check the time that a slave was detected or the time that it was lost. You can also change the settings of a slave in the list.
4-2. About the buttons
Delete information of the selected lost slave from the slave list.
Refresh the slave list page display.
- [Save as CSV] button
Save the slave list as a CSV file.
- [Setting] button
Make slave settings.
4-3. Checking a slave
In the list you can check the slave information that is managed by the LAN map. You can press each item’s Sort switch to sort the list. The initial screen is sorted in order of route. Lost slaves are shown highlighted in gray.
4-4. Making slave settings
You can edit the settings for the slaves that are managed by the LAN map. Settings can be changed on some Yamaha switches. Press the [Setting] button of the slave whose settings you want to change, and then change the settings. You can set the following items.
Device name
Specify the device name of the slave.
- When “Default device name” is selected, the default names that are predetermined for each device will be set. Normally, this is text that shows the model name and serial number.
- When “Manual settings” is selected, the device name that was inputted in the input box right afterwards will be set. Input a device name of up to 32 single-byte characters. The characters that can be input will differ depending on the target slave. See “6-2. Setting and maintaining switches” in “Map” for details.
4-5. Deleting a lost slave
You can delete information of a lost slave from the slave list. Select the lost slave information that you want to delete, and press the “Delete” button. The lost slave information that you selected is deleted.
4-6. Saving a list to a CSV file
You can save the slave list as a CSV file. Press the [Save as CSV] button. The slave list is saved as a CSV file.
List map
1. Summary
The whole map shows all devices connected to the network, using a single topology.You can switch the topology display range and the device information view, to customize the display and make it easier to view.Use the print function to print the whole map displayed, in order to make use of the map in various network operation management-related situations.
2. Notes
- Cookies are used and saved for the whole map view settings.Enable cookies on your browser to save the whole map view settings.See the help content supplied with your browser for instructions on how to enable cookies.If you have made changes to the settings but the changes are not reflected when accessing the whole map once more, cookies may be disabled or have been deleted in your browser.
- You can confirm the link speed between devices (the link speed of the port belonging to higher devices) and link speed, by checking the color and shape of the connector lines between the device icons.
- See the legend at the top right of the screen for how the colors correspond to link speeds.
- The link speeds of terminals connected to slaves for which the type cannot be determined are shown using gray-colored connector lines.
3. About the buttons
Used for the focus function.See 8. Using the focus function for details.
Used for the focus function.See 8. Using the focus function for details.
The page will reload.
Here you can configure the information shown on the whole map.For details, see “5. Switching the device information view”, “6. Displaying/hiding a terminal” and “7. Switching the port information view.”
This opens the screen for printing. See “9. Printing the whole map” for details.
 “Print preview” button
4. About the mini whole map
The mini whole map is a reduced version of the whole map.Use this to get a birds’-eye view of the entire map.You can also use the focus function to understand which slave is getting the focus.See 8. Using the focus function for details.
Note: If the total number of masters, slaves and SSIDs on the whole map exceed 200, the mini whole map will not be displayed.
5. Switching the device information view
You can switch the device information shown on the right-hand side of the device icons.You can set the items to be displayed for the slaves and terminals individually.Use the following operations to configure the settings.
Press the
Select the items to view using the drop-down list boxes to the right of the “slave information” and “terminal information” on the view settings screen.When these items are selected, the device information shown at the right of the device icons on the whole map will switch to the selected item.The settings will automatically be saved at the timing in which they are switched.
Note: The four drop-down list boxes are lined up vertically corresponding to the order in which the device information to the right of the device icons on the whole map is displayed.
Slave information to view can be selected from the following.
- Device name
- MAC address
- Model name
- IP address
- Hide
Terminal information to view can be selected from the following.
- IP address
- Manufacturer
- Device name
- MAC address
- Model name
- Comment
- OS
- Hide
Note: Up to 30 single-byte characters are displayed for the device information. If the text length exceeds 30 single-byte characters, the rest of the item will be omitted.
6. Displaying/hiding a terminal
You can switch between displaying or hiding terminals shown on the whole map.If you do not need to manage terminals, you can hide the terminals and show only the slaves, making the view easier to read.Use the following operations to configure the settings.
Press the
Select the check box to the left of the “Terminal information” text on the view settings screen to display the terminal, and deselect the check box to hide the terminal.The settings will automatically be saved at the timing in which they are switched.
7. Switching the port information view
You can switch between displaying or hiding the connecting port and VLAN information shown on the topology of the whole map.Use the following operations to configure the settings.
Press the
Select the check boxes in “Port information” on the view settings screen for the “Port number” and “VLAN-ID” to view this information, and deselect the check boxes to hide the information.The settings will automatically be saved at the timing in which they are switched.
8. Using the focus function
Press the slave icon on the whole map for a focused view of the topology, including the selected slaves and the devices that they control.
Focusing on this view will enable the “Top” button and the
“Up” button in the top left part of the screen.Press the
“Top” button to return to a view of the overall topology, centered on the master.Press the
“Up” button on the top left part of the screen to view the topology, centered on the slaves or masters one level above.The slaves that are at the center of the topology’s focus are shown within a blue border on the mini whole map at the right side of the screen, which helps you to understand their location.You can also view the “Route” in the upper left part of the screen to confirm the location of a slave.
9. Printing the whole map
Using the whole map, you can print the currently viewed whole map from the Print preview.Use the following operations to print.
Press the
Check the Print preview and press the [Print this page] button on the upper part of the screen if everything looks the way you want it.The browser’s print preview will be displayed.Set the paper size to A4 or larger when printing.
Note: When changing the focus or device information view after displaying the Print preview, close the Print preview first, make changes to the focus or device information view on the whole map, and then press the
Note: When opening a slave configuration series for a topology that is long (in other words, a topology that is too wide to fit) in the Print preview, the width of the topology on the Print preview will be adjusted to horizontally accommodate A4-sized paper.
- SWR2310 Series Technical Data (GUI)
- Detailed settings
- Interface settings
Interface settings
1. Summary
This page is for changing the physical interface settings.
2. Top page
This is the top page for the interface settings.
Interface list
- The current operating status and settings for the physical interface are shown for each interface.
- The table items are explained below.
- Check box
- Select the check box for bulk settings or to initialize the settings.
- Port
- Displays the interface name.
- Link
- Displays the link status for the interface.
- Displays the port type in parentheses for other ports besides the LAN.
- Speed/communication mode
- Displays the operating speed and communication mode.
- For automatic settings, “(Automatic)” is displayed at the end of the status indication.
- EEE
- Displays the operating status of the EEE function.
- Explanation
- Displays the description text that is set for the interface.
- Check box
- Press the [Setting] button to display the page where you can change the settings of the selected interface.
- If you press the [Specify all] button, the settings can be changed for all interfaces whose check box is selected.
- Bulk settings cannot be made by selecting ports of different types.
- The default settings will be applied to the settings on the physical interface settings page.
- If you press the [Return to default] button, the settings will be initialized on all interfaces whose check boxes are selected.
- Each of the default settings are shown below.
- Operation : Enable interface
- Explanation : Unset
- Speed/communication mode : Automatic
- EEE function : Disabled (Don’t use power-conservation Ethernet function)
- Each of the default settings are shown below.
3. Physical interface settings page
This page is for changing physical interface-related settings.
Enter the settings, and then press the [Confirm] button.
If there are no mistakes in the input content of the confirmation screen, press the [OK] button.
Physical interface settings
- Port
- Displays the name of the interface for which settings will be made.
- Operation
- Select from the following interface operations.
- Enable interface
- Disable interface
- Select from the following interface operations.
- Explanation
- Sets the interface description text.
- Characters that can be inputted include single-byte alphanumeric characters and symbols, excluding ?.
- Up to 80 characters can be inputted.
- Speed/communication mode
- Select the interface speed and communication method from the following options.
- For a LAN port
- Automatic
- 1Gbps / Full duplex
- 100Mbps / Full duplex
- 100Mbps / Half duplex
- 10Mbps / Full duplex
- 10Mbps / Half duplex
- For an SFP port or combo port
- Automatic
- 1Gbps / Full duplex
- For an SFP+ port
- Automatic
- 10Gbps / Full duplex
- For a LAN port
- Select the interface speed and communication method from the following options.
- EEE function
- EEE functions can only be set for the LAN port and combo port.
- Select the operation for the EEE function from the following options.
- Disabled (Don’t use power-conservation Ethernet function)
- Enabled (Use power-conservation Ethernet function)
- SWR2310 Series Technical Data (GUI)
- Detailed settings
- Link aggregation
Link aggregation
1. Summary
This page is for configuring the link aggregation settings.
2. Top page
This is the top page for link aggregation.
System settings
- Shows the system settings related to link aggregation.
- The table items are explained below.
- LACP system priority
- Displays the LACP priority set in this system.
- Load balance rules
- Displays the load balance settings.
- LACP system priority
- Press the [Setting] button to show the page for system settings related to link aggregation.
Interface list
- The operating status and settings are shown for the logical interface and the physical interface.
- The table items are explained below.
- Check box
- Select the check box to delete the logical interface.
- Port
- Displays the interface name.
- Link
- Displays the link status for the interface.
- LACP status
- One of the following statuses are displayed for the LACP status of the interface.
- Waiting
- Negotiating
- Communication OK
- -
- One of the following statuses are displayed for the LACP status of the interface.
- LACP priority
- During actual operation, the priority will be displayed.
- Displays a value from 1 to 12 for the priority, calculated based on the LACP priority setting.
- Explanation
- Displays the description text that is set for the interface.
- Press the [New] button to display a page where you can create new settings for a logical interface.
- Press the [Setting] button to display the page where you can change the settings of the selected logical interface.
- If you press the [Delete] button, all logical interfaces whose check boxes are selected will be deleted.
- When deleting a logical interface, you can specify the physical interface operations after deletion as follows.
- Enable
- Disable
- When deleting a logical interface, you can specify the physical interface operations after deletion as follows.
- Up to 127 logical interfaces can be configured.
- Up to 96 static logical interfaces can be configured.
3. System settings
This page is for configuring link aggregation-related system settings.
Enter the settings, and then press the [Confirm] button.
If there are no mistakes in the input content of the confirmation screen, press the [OK] button.
System settings
- LACP system priority
- Specify the LACP system priority.
- The input range is 1 - 65535.
- Load balance rules
- The following load balance rules can be selected.
- Destination MAC address
- Source MAC address
- Destination/source MAC address
- Destination IP address
- Source IP address
- Destination/source IP address
- Destination port number
- Source port number
- Destination/source port numbers
- The following load balance rules can be selected.
4. Logical interface settings page
This page is for changing the logical interface settings.
Enter the settings, and then press the [Confirm] button.
If there are no mistakes in the input content of the confirmation screen, press the [OK] button.
Logical interface settings
- Logical interface
- When configuring new settings
- The logical interface type can be selected from the following types.
- Static logical interface
- LACP logical interface
- Cannot be selected when the stack function is enabled
- The logical interface type can be selected from the following types.
- When changing settings
- Displays the selected logical interface name.
- When configuring new settings
- Interface number
- Specifies the interface number.
- A value from 1 to 96 can be inputted for a static logical interface.
- A value from 1 to 127 can be inputted for an LACP logical interface.
- This item will be displayed only when configuring new settings.
- Associated port
- Select the port that will be associated with the logical interface.
- Press the [Select] button to display the “Physical interface list” dialog box.
- Select the port check box in the “Physical interface list” dialog box and press the [Confirm] button to select the associated port.
- Up to eight ports can be selected for a static logical interface, and up to 12 ports can be selected for an LACP logical interface.
- When displaying the dialog box for the “Logical interface” item with the LACP logical interface selected, the following settings can be made for each associated port.
- Operation mode
- Active
- Passive
- LACP priority
- 1 - 12
- LACP timeout
- 3 Seconds
- 90 Seconds
- Operation mode
- Operation
- Select from the following logical interface operations.
- Enable interface
- Disable interface
- Select from the following logical interface operations.
- Explanation
- Sets the interface description text.
- Characters that can be inputted include single-byte alphanumeric characters and symbols, excluding ?.
- Up to 80 characters can be inputted.
Create VLAN
1. Summary
In this page you can create or delete VLANs, and change the IP address.
2. Top page
This is the top page for creating a VLAN.
VLAN list
- Information for the defined VLANs is displayed
- A maximum of 20 items can be displayed for one page. Press
- You can press the sort switch to sort by each item.
- Press the [New] button to access a page where you can create a new VLAN
- Press the [Setting] button to access a page where you can change the settings of the selected VLAN
- If you press the [Delete] button, all VLANs whose check box has a check mark will be deleted
- The following VLAN cannot be deleted
- Default VLAN ( VLAN ID = 1 )
- Private VLAN
- The following VLAN cannot be deleted
- Up to 256 VLANs can be created including the default VLAN (VLAN ID = 1).
3. VLAN settings page
In this page you can create a new VLAN or edit the settings of an already-defined VLAN.
Enter the settings, and then press the [Confirm] button.
If there are no mistakes in the input content of the confirmation screen, press the [OK] button.
VLAN settings
- VLAN ID
- To create a new VLAN, enter the desired VLAN ID within the valid range (2-4094)
- The smallest ID of the unregistered VLAN IDs is entered as the default value
- If an already-registered VLAN ID is entered, it is handled as a change in settings
- When changing the settings, it is not possible to change the VLAN ID
- To create a new VLAN, enter the desired VLAN ID within the valid range (2-4094)
- Name
- Specify the name of the VLAN using up to 32 single-byte alphanumeric characters and symbols.
- The default VLAN (VLAN ID = 1) cannot be renamed
- A space and “?” cannot be used in the name of the VLAN.
- Specify the name of the VLAN using up to 32 single-byte alphanumeric characters and symbols.
- Frame transmission
Select frame forwarding from the following items.
- Enable frame transmission
- Disable frame transmission
- Frame forwarding cannot be disabled for the default VLAN (VLAN ID = 1)
- IPv4 address
Select the IP address from the following items. Only a VLAN for which frame forwarding is valid can be specified for this item.
Up to 8 VLAN interfaces can be configured for an IPv4 address.
- Not set
- Obtain automatically using DHCP
- Selecting the check box for “Setting the link local address when auto-acquire does not work” will enable the Auto IP function.
- The Auto IP function can be enabled for only one VLAN interface.
- Cannot be selected when the stack function is enabled
- Specify a fixed IP address
- Enter the IP address and subnet mask
- IPv6 address
Up to 8 VLAN interfaces can be configured for an IPv6 address.
The IPv6 address cannot be configured when the stack function is enabled.
- Select whether the IPv6 address will be enabled or disabled from the following items.
- Disable IPv6
- Enable IPv6
- For global addresses, select from the following items.
- Not set
- Obtain automatically using RA
- Specify a fixed IP address
- Enter the IP address and subnet mask
- Set the link local address.
- Select whether the IPv6 address will be enabled or disabled from the following items.
Tag VLAN
1. Summary
In this page you can make settings for tagged VLANs.
2. Top page
This is the top page for tagged VLANs.
Tag VLAN settings
- The various settings for tagged VLANs are shown for each LAN/SFP port
- “Frame types that can be received” is displayed according to the operating mode and the VLAN settings. (This item cannot be set in the settings page.)
- Press the [Setting] button to access a page where you can change the settings for the tagged VLAN of the selected port
- If you press the [Specify all] button, the settings can be changed for all LAN/SFP ports whose check box contains a check mark
- If you press the [Return to default] button, the settings will be initialized for all LAN/SFP ports whose check box contains a check mark
- Default settings for a tagged VLAN are as follows
- Operating mode: Access
- Assigned VLAN: Default VLAN (VLAN ID = 1)
- Default settings for a tagged VLAN are as follows
- Settings for the LAN/SFP port assigned to a private VLAN cannot be changed
- Settings for the LAN/SFP port used for link aggregation cannot be changed
- If the operation mode is “Trunk,” both the native VLAN and the trunk VLAN are shown as assigned VLANs.
3. Tagged VLAN settings page
In this page you can make various settings related to tagged VLANs.
Enter the settings, and then press the [Confirm] button.
If there are no mistakes in the input content of the confirmation screen, press the [OK] button.
Tag VLAN settings
- Port
- The LAN/SFP port for which settings are made is shown
- Operation mode
- Access
- The corresponding port is specified as the access (untagged) port
- Trunk
- The corresponding port is specified as the trunk (tagged) port
- Access
- AccessVLAN
- This item is shown only if the operating mode is “Access”.
- From the list, select the access port’s assigned VLAN
- However, the following cannot be selected as access VLAN.
- PrivateVLAN
- VLAN for which frame forwarding is invalid
- NativeVLAN
- This item is shown only if the operating mode is “Trunk”.
- From the list, select the assignment-destination VLAN (native VLAN) for untagged frames received from the trunk port.
- However, the following cannot be selected as native VLAN.
- VLAN selected as trunk VLAN
- PrivateVLAN
- VLAN for which frame forwarding is invalid
- TrunkVLAN
- This item is shown only if the operating mode is “Trunk”.
- Specify the assignment-destination VLAN (trunk VLAN) for tagged frames received at the trunk port.
- When you press the [Select] button, a list of the selectable VLAN IDs appears in a separate window
- However, the following cannot be selected as trunk VLAN.
- VLAN selected as native VLAN
- PrivateVLAN
- VLAN for which frame forwarding is invalid
- Place a check mark in the check box of the VLAN ID that you want to specify, and press the [Confirm] button
- Ingress filter
Select the ingress filter from the following items. This item is shown only if the operating mode is “Trunk.”
- Enabled ( Receive only if the VLAN ID of the incoming frame is the same as the associated VLAN )
- Disabled ( Receive all frames )
Multiple VLAN
1. Summary
In this page you can make multiple VLAN settings.
The multiple VLAN function is used to divide ports for one switch into different groups and prohibit communication between the groups.
A single port can belong to multiple groups, so that the same network address can be assigned even to different groups.
If both the multiple VLAN and port-based VLAN / tagged VLAN are used, communication is not possible between ports that belong to different VLANs, even if the ports belong to same multiple-VLAN group.
2. Top page
This is the top page for multiple VLANs.
Tag VLAN settings
- The multiple VLAN group settings are shown for each LAN port and logical interface.
- Press the [Setting] button to access a page where you can change the settings for the multiple VLAN of the selected interface.
- If you press the [Specify all] button, the settings can be changed for all LAN ports and logical interfaces whose check box contains a check mark.
- If you press the [Return to default] button, the settings will be initialized for all LAN ports and logical interfaces whose check box contains a check mark.
- In default settings, no interfaces belong to a group.
3. Multiple VLAN settings page
In this page you can make the multiple VLAN settings.
Enter the settings, and then press the [Confirm] button.
If there are no mistakes in the setting confirmation screen, press the [OK] button.
Multiple VLAN settings
- Port
- The LAN port or logical interface for which settings are made is shown
- Group
- Select the VLAN groups to join.
- Press the [Select] button to display the “Multiple VLAN group selection” dialog box.
- Groups to join a VLAN can be selected by selecting the corresponding checkboxes in the “Multiple VLAN group selection” dialog and press the [OK] button.
- SWR2310 Series Technical Data (GUI)
- Detailed settings
- MAC address table
MAC address table
1. Summary
In this page you can edit the settings of the MAC address table function.
2. Top page
This is the top page for the MAC address table.
Basic settings for MAC address learning function
- The current settings for the MAC address learning function are shown
- When you press the [Setting] button, a page where you can change the MAC address learning function settings will appear
Static MAC address table settings
- The static MAC address table is shown as a list
- A maximum of 20 items can be displayed for one page. Press
- You can press the sort switch to sort by each item.
- If you press the [New] button, a page appears in which you can create a new static MAC address entry.
- If you press the [Setting] button, a page appears in which you can edit the settings of the selected static MAC address entry.
- If you press the [Delete] button, all static MAC address entries whose check box has a check mark will be deleted
- Up to 512 static MAC address entries can be created from the Web GUI.
3. MAC address learning function basic settings page
In this page you can make settings for the MAC address learning function.
Enter the settings, and then press the [Confirm] button.
If there are no mistakes in the input content of the confirmation screen, press the [OK] button.
Basic settings for MAC address learning function
- MAC address learning function
Select the MAC address learning function from the following items.
- Use MAC address learning function
- Don’t use MAC address learning function
- Aging time for dynamic entries
- Specify a setting in the range of 10 seconds to 400 seconds. The default value is 300 seconds
4. Static MAC address table settings page
In this page you can make static MAC address settings.
Enter the settings, and then press the [Confirm] button.
If there are no mistakes in the input content of the confirmation screen, press the [OK] button.
Static MAC address settings
- Kind
Choose from the following items as the type of MAC address to be registered in the static MAC address table.
- Register a unicast MAC address
- Register a multicast MAC address
- Destination MAC address
- Enter the MAC address in the format hhhh.hhhh.hhhh.
- Frame processing
From the following items, select the processing for frames sent to the destination MAC address.
- Forward frames that are being sent to the destination MAC address
- Discard frames that are being sent to the destination MAC address
- If a multi-cast MAC address is registered, “Forward” is the only frame processing that can be specified
- Destination VLAN ID
- Select the forwarding-destination VLAN ID from those that are registered in the VLAN database
- Forwarding destination interface
- If you press the [Select] button, the interfaces assigned to the forwarding-destination VLAN ID are shown as a list
Place a check mark in the check box of the interface that you want to use as the forwarding-destination interface, and press the [Confirm] button
- If registering a unicast MAC address, you can specify one interface
- If registering a multicast MAC address, you can specify multiple interfaces
- If you press the [Select] button, the interfaces assigned to the forwarding-destination VLAN ID are shown as a list
Routing
1. Summary
This page is for configuring the routing settings.
2. Top page
This is the top page for routing.
Routing function basic settings
- The current settings for the routing function are shown.
- When you press the [Setting] button, a page where you can change the routing function settings will appear.
Routing table
- Displays the routing table details.
- The table items are explained below.
- Check box
- Select the check box to delete static route information.
- Enabled route
- For the route used in actual communications,
- For the routes not used for actual communications,
- For the route used in actual communications,
- Kind
- Displays one of the following route information types.
- static
- connected
- Displays one of the following route information types.
- Destination
- Displays the destination network address for the route information.
- If the destination is a default gateway, default will be displayed.
- Gateway
- Displays the route information gateway.
- Null is displayed for settings to discard packets.
- Priority
- Displays the administrative distance for route information.
- Check box
- Press the [New] button to display a page where you can create new settings for static route information.
- Press the [Setting] button to display a page where you can change the settings for the selected static route information.
- If you press the [Delete] button, all static route information for which the check boxes are selected will be deleted.
- A check box and [Setting] button is displayed for the static route information entry.
- Up to 128 routing information entries can be displayed.
- When 128 routing information entries are displayed, the [New] button is disabled.
 Enabled will be displayed.
 Disabled will be displayed.
3. Routing function basic setting page
In this page you can specify whether the routing function is used.
Enter the settings, and then press the [Confirm] button.
If there are no mistakes in the input content of the confirmation screen, press the [OK] button.
Routing function basic setting page
- Routing function
Select the routing function from the following items.
- Use routing function
- Don’t use routing function
4. Static route information settings page
This page is for configuring the static route information settings.
Enter the settings, and then press the [Confirm] button.
If there are no mistakes in the input content of the confirmation screen, press the [OK] button.
Static route information settings
- Destination network
- When configuring new settings
- Select a destination network from the following networks.
- Specifying a network address
- Input the destination network address.
- Default gateway
- Specifying a network address
- Select a destination network from the following networks.
- When changing settings
- The destination network address is displayed.
- When configuring new settings
- Gateway
- Select from one of the following gateways.
- Specifying an IP address
- Input the gateway IP address.
- Discarding a packet without forwarding
- Specifying an IP address
- Select from one of the following gateways.
- Priority
- Input the priority.
- The input range is 1 - 255.
DNS client
1. Summary
This page is for configuring the DNS client settings.
2. Top page
This is the top page for the DNS client.
DNS client settings
- Displays the DNS client settings.
- The table items are explained below.
- DNS client functions
- Displays the settings for whether to enable or disable the DNS client function.
- DNS server address
- Displays the DNS server address settings used during inquiry for name resolution.
- Default domain
- Displays the default domain settings.
- Search domain
- Displays the search domain settings.
- DNS client functions
- Press the [Setting] button to access a page where you can configure the DNS client settings.
3. DNS client settings page
This page is for configuring the DNS client settings.
Enter the settings, and then press the [Confirm] button.
If there are no mistakes in the input content of the confirmation screen, press the [OK] button.
DNS client settings
- DNS client functions
- Select the operation for the DNS client function from the following options.
- Enable
- Disable
- Select the operation for the DNS client function from the following options.
- DNS server address
- Specify the DNS server address.
- For the server address, either an IPv4 address or an IPv6 address can be specified.
- Up to three server addresses can be specified.
- Default domain
- Specify the default domain.
- Up to 256 characters can be inputted.
- Search domain
- Specify the search domain.
- Up to 256 characters can be inputted.
- Up to six search domains can be specified.
- SWR2310 Series Technical Data (GUI)
- Detailed settings
- IGMP snooping
IGMP snooping
1. Summary
In this page you can edit the settings of the IGMP snooping function.
2. Top page
This is the top page for IGMP snooping.
IGMP snooping function settings
- IGMP snooping function settings are shown for each VLAN ID that is defined
- A maximum of 20 items can be displayed for one page. Press
- When you press the [Setting] button, a page where you can change the IGMP snooping function settings for the selected VLAN ID will appear
- If you press the [Specify all] button, the settings can be changed for all VLAN IDs whose check box contains a check mark
- If you press the [Return to default] button, the settings will be initialized for all VLAN IDs whose check box contains a check mark
- Default settings for the IGMP snooping function are as follows
- IGMP snooping function: Enabled
- IGMP version: IGMPv3
- IGMP querier: Disabled
- IGMP query transmission interval: 125 seconds
- TTL check: Enabled
- Default settings for the IGMP snooping function are as follows
3. IGMP snooping function settings page
In this page you can make various settings for the IGMP snooping function.
Enter the settings, and then press the [Confirm] button.
If there are no mistakes in the input content of the confirmation screen, press the [OK] button.
IGMP snooping function settings
- VLAN ID
- The VLAN ID for which settings are being made is shown
- IGMP snooping function
- Enabled ( Control transmission of IP multicast packets )
- Enables the IGMP snooping function By monitoring (snooping) the IGMP messages that are exchanged between the receiving equipment and the multicast router, multicast packet flooding can be controlled, limiting the network bandwidth that is used.
- Disabled ( Flood IP multicast packets )
- Disables the IGMP snooping function Multicast packets are always forwarded to all ports in the same VLAN.
- Enabled ( Control transmission of IP multicast packets )
- IGMP version
Select the IGMP version from the following items.
- IGMPv3
- IGMPv2
- IGMP querier
- Enabled ( Periodically transmit IGMP queries )
- IGMP query transmission function is enabled. The transmission interval can be specified in the range of 20 seconds to 18000 seconds
- Disabled ( Don’t transmit IGMP queries )
- IGMP query transmission function is disabled
- Enabled ( Periodically transmit IGMP queries )
- TTL check
Select the TTL check from the following items.
- Enabled ( IGMP packets other than TTL=1 are discarded )
- Disabled ( IGMP packets other than TTL=1 are corrected to TTL=1 and transmitted )
- SWR2310 Series Technical Data (GUI)
- Detailed settings
- Access lists
- Creating an access list
Creating an access list
1. Summary
In this page you can create or delete access lists, and change their settings.
2. Top page
This is the top page for creating an access list.
Access lists
- The information for the access list you created will be displayed.
- The table items are explained below.
- ID
- The access list ID will be displayed.
- Type
- The access list type will be displayed.
- Comment
- The comment set in this access list will be displayed.
- ID
- A maximum of 20 items can be displayed for one page. Press
- You can press the sort switch to sort by each item.
- Press the [New] button to display the page where you can create a new access list.
- Press the [Setting] button to show the page where you can change the settings of the selected access list.
- If you press the [Delete] button, all access lists whose check boxes are selected will be deleted.
- Access lists that are applied to class maps cannot be deleted.
- On this page, you can reference and configure up to 512 access lists.
3. Access list settings page
This page is for creating new access lists, or for changing the settings of existing access lists.
Enter the settings, and then press the [Confirm] button.
If there are no mistakes in the input content of the confirmation screen, press the [OK] button.
Access list settings
- Access list
- Select the access list type from the following items.
- IPv4 access list
- IPv6 access list
- MAC access list
- When changing the settings, the access list type cannot be changed.
- The IPv6 access list settings cannot be configured when the stack function is enabled.
- Select the access list type from the following items.
- Access list ID
- Set the configurable access list ID from the following ranges, according to the access list type.
- IPv4 access lists
- 1 - 2000
- IPv6 access lists
- 3001 - 4000
- MAC access lists
- 2001 - 3000
- IPv4 access lists
- When changing the settings, the access list ID cannot be changed.
- Set the configurable access list ID from the following ranges, according to the access list type.
- Comment
- Specify the comment using up to 32 single-byte alphanumeric characters and symbols.
- The “?” character cannot be used in the comment text.
- Control conditions
- Specify the control conditions for the access list.
- Up to 256 control conditions can be configured per access list.
- Press the [Add] button to display the “Control condition settings” dialog.
- In the “Control condition settings” dialog, you can specify conditions for which traffic is permitted and denied as per the following items.
- Operation
- Select the actions to be taken when the traffic matches the control conditions, shown in the items below.
- Permit
- Deny
- Select the actions to be taken when the traffic matches the control conditions, shown in the items below.
- Source address
- Select the source address to be targeted from the following items.
- All addresses
- Specify host address
- Specifying a network address
- This cannot be specified for a MAC access list.
- Specify host address with wildcard bit
- Specify the address and wildcard mask.
- This cannot be specified for a IPv6 access list.
- If the wildcard mask bit is “1,” the bit in the same address position will not be checked.
- When specifying the conditions for subnet 192.168.1.0/24, do so as shown below.
- Address : 192.168.1.0, Wildcard mask : 0.0.0.255
- When specifying the conditions for vendor code 00-A0-DE-*-*-*, do so as shown below.
- Address : 00A0.DE00.0000, Wildcard mask : 0000.00FF.FFFF
- Select the source address to be targeted from the following items.
- Destination address
- The details for the items to be set for the destination address are equivalent to those of the source address.
- This cannot be specified for a IPv6 access list.
- Protocol
- Select the protocol to be targeted from the following items.
- All protocols
- TCP
- UDP
- ICMP
- Specify protocol number
- Input a protocol number from 0 to 255.
- When selecting TCP or UDP as a protocol, specifying the source and destination port numbers.
- You can specify either a single number or a number range for the port number.
- Input a port number from 0 to 65535.
- When selecting TCP as a protocol, you can specify the conditions regarding the TCP vendor control flag.
- When selecting the Use established traffic as target check box, you can target packets for which either the ACK bit or the RST bit of the control flag is set to 1.
- On the initial packet prior to establishing TCP communications, the ACK and RST bit values will be 0.
- For this reason, TCP connections from outside coming in can be denied by allowing only packets with an ACK or RST bit on the control flag set to 1, and connections from inside going out can be permitted.
- This cannot be specified for a MAC access list or a IPv6 access list.
- Select the protocol to be targeted from the following items.
- Operation
- Press the [Delete] button to delete the corresponding control conditions.
- Press the
- When evaluating the control conditions, control conditions with earlier numbers will be evaluated first; and if the conditions match, the conditions that follow will not be checked.
 or
or  icons to change the order in which the control conditions are applied.
- SWR2310 Series Technical Data (GUI)
- Detailed settings
- Access lists
- Apply access list
Apply access list
1. Summary
Apply the access list for the interface on this page.
2. Top page
This is the top page for applying the access list.
Interface list
- The access list information applied to the interface is displayed.
- The table items are explained below.
- I/F
- Displays the interface name.
- Access list (IN)
- The information listed below for the access list applied to the input side of the interface is shown here.
- ID
- The access list ID will be displayed.
- Type
- The access list type will be displayed.
- Comment
- The comment set in this access list will be displayed.
- ID
- The information listed below for the access list applied to the input side of the interface is shown here.
- Access list (OUT)
- Information for the access list applied to the input side of the interface is shown here.
- Information similar to the access list (IN) will be displayed.
- I/F
- Press the [Setting] button to display the page where you can change the settings of the selected interface.
- If you press the [Specify] button, the settings can be changed for all interfaces whose check box is selected.
- If you press the [Return to default] button, the settings will be initialized on all interfaces whose check boxes are selected.
3. Selection page for access lists to apply
This page is for selecting the access list to apply to the interface.
Enter the settings, and then press the [Confirm] button.
If there are no mistakes in the input content of the confirmation screen, press the [OK] button.
Select access list to apply
- Applicable interface
- The interface on which the access list will be applied is displayed.
- Access list to apply (IN)
- Select the access list to apply to the input side of the interface.
- Press the [Select] button to display the file “Access list selection” dialog box.
- On the “Access list selection” dialog, you can select the check box for an access list and press the [Confirm] button to select the access list to apply.
- Press the [Detail] button in the “Access list selection” dialog box to display the targeted access list.
- In the IPv4 access list which specifies port numbers by range, only one interface can be applied for the entire system.
- The number of control conditions that can be applied to an interface are 512 for the entire system.
- Applying an access list to one interface will decrease a number of applicable control conditions equal to the control conditions included in the access list.
- For example, when an access list with five specified control conditions is applied to the input side of port1.1, the number of control conditions that can be applied is decreased by 5.
- Note that the number of control conditions that can be actually applied is less than 512, because the control conditions are also used in the system and other functions.
- Access list to apply (OUT)
- Select the access list to apply to the output side of the interface.
- The setting details for the access list (OUT) to be applied are equivalent to the access list (IN) to be applied.
- For VLAN interfaces, an access list cannot be applied to the output side.
- IPv4 access lists which specify port numbers by range cannot be applied to the output side.
QoS
1. Summary
In this page you can edit the settings of the QoS (Quality of Service) function.
You can enable/disable the QoS function, and change the trust mode.
2. Top page
This is the top page for QoS.
QoS function basic settings
- The current setting is shown as to whether the QoS function is used
- Press the [Setting] button to access a page where you can change the settings
- To enable the QoS function, you must disable flow control after entering CLI global configuration mode.
QoS function settings
- The trust mode setting used by the QoS function is shown for each LAN/SFP port
- Press the [Setting] button to access a page where you can change the settings of the selected LAN/SFP port
- If you press the [Specify all] button, the settings can be changed for all LAN/SFP ports whose check box contains a check mark
- If you press the [Return to default] button, the settings will be initialized for all LAN/SFP ports whose check box contains a check mark
- The default trust mode setting for all ports is “CoS”
- If the settings do not use the QoS function, QoS function settings cannot be made
3. QoS function basic settings page
In this page you can specify whether the QoS function is used.
Enter the settings, and then press the [Confirm] button.
If there are no mistakes in the input content of the confirmation screen, press the [OK] button.
Be aware that if the settings do not use the QoS function, all QoS-related settings will be cleared.
QoS function basic settings
- QoS function
- Don’t use QoS function
- The QoS function will be disabled. At this time, all QoS settings will be cleared.
- Use QoS function
- The QoS function will be enabled. QoS-related settings and commands can be executed.
- Don’t use QoS function
4. QoS function settings page
Set the “Trust mode” setting which means whether the transmission queue is determined based on the packet’s CoS value or the DSCP value or the Port priority.
Enter the settings, and then press the [Confirm] button.
If there are no mistakes in the input content of the confirmation screen, press the [OK] button.
QoS function settings
- Port
- The LAN/SFP port for which settings are made is shown
- Trust mode
- Use CoS value to determine transmission queue
- The packet’s CoS value and the “CoS - Transmission queue ID conversion table” are used to determine the transmission queue
- If the received packet is an untagged packet, the default CoS value is applied
- For details on checking and changing the default CoS value and the “CoS - Transmission queue ID conversion table,” refer to the command reference
- Use DSCP value to determine transmission queue
- The packet’s DSCP value and the “DSCP - Transmission queue ID conversion table” are used to determine the transmission queue
- For details on checking and changing the “DSCP - Transmission queue ID conversion table,” refer to the command reference
- Use the priority specified for the port to determine the transmission queue
- The transmission queue is determined according to the “Port priority order”
- Select the transmission queue to be assigned as the port priority order in the range of 0 - 7 Higher numbers indicate a higher priority order; with the default settings, 2 is selected
- The setting can be changed only if the trust mode is set to “Port priority”
- If a policy map is applied to the LAN/SFP port, you cannot change the trust mode setting.
- Use CoS value to determine transmission queue
- SWR2310 Series Technical Data (GUI)
- Detailed settings
- Mail notification
Mail notification
1. Summary
In this page you can make settings related to mail notification. When a mail notification is received, mail is automatically sent to the assigned recipient when the specified conditions are met.
First use the [New] button in “Registered mail server list” to register the mail server of the recipient. After registering this, use the [New] button in “Mail notification settings list” to make mail notification settings.
Mail notification settings can be made only from the Web GUI. Although the setting contents of the mail notification are not shown in the CONFIG file, when an operation (such as “erase startup-config”) is performed on the CONFIG file, the same operation is performed on the mail notification settings.
2. Top page
This is the top page for mail notifications.
List of registered mail servers
- Information for the currently registered mail server (SMTP server) is shown.
- You can use the [New] button at the top of the list to add settings.
- If you want to change the settings, press the [Settings] button located at the right of the table. A page for changing the settings appears, allowing you to change the settings.
- If you want to delete settings, select the setting that you want to delete, and press the [Delete] button located above the list. A confirmation dialog box appears; press the [Delete] button to delete the setting.
- Up to 10 mail servers can be registered.
List of mail notification settings
- The currently specified mail notification settings are shown.
- You can use the [New] button at the top of the list to add settings.
- If you want to change the settings, press the [Setting] button located at the right of the table. A page for changing the settings appears, allowing you to change the settings.
- If you want to delete settings, select the setting that you want to delete, and press the [Delete] button located above the list. A confirmation dialog box appears; press the [Delete] button to delete the setting.
- If you want to do mail sending test, press the [Next] button located at “Sending test” item. A confirmation dialog box appears; press the [OK] button to do mail sending test.
3. Mail server settings page
This page lets you make settings for the recipient’s mail server (SMTP server). Check the items that you specified, and then press the [Confirm] button. If there are no mistakes in the input content confirmation screen, press the [OK] button.
List of registered mail servers
- ID
- This is the identifying number of the mail server settings. It is assigned automatically.
- Account identification name
- Specify the mail server’s account identification name. For convenience, specify a name that will be easy to recognize.
- You can use up to 64 single-byte characters.
- This can be omitted.
- SMTP server address
- Enter the IP address or domain name of the SMTP server used when sending mail.
- You can use up to 64 single-byte characters.
- SMTP server port number
- Enter the SMTP server’s port number.
- If “Submission port (port number 587)” is checked, the submission port, which is port number 587, is specified.
* This function does not support SMTP authentication.
4. Mail notification settings page
In this page you can make mail notification settings. You can specify the transmission source and the recipient address of mail notifications. Check the items that you specified, and then press the [Confirm] button. If there are no mistakes in the input content confirmation screen, press the [OK] button.
*Note) Mail notification settings cannot be made if there are no “Mail server settings”.
Mail notification settings
- ID
- This is the identifying number of the mail notification settings. It is assigned automatically.
- Source (From)
- Specify the sender’s mail address of the mail that will be sent.
SMTP server:
- Select the SMTP server used when sending the mail.
Mail address:
- Enter the sender’s mail address of the mail that will be sent.
- You can use up to 64 single-byte characters. However, you cannot use symbols other than underline (_), hyphen (-), dot (.), and at-sign (@).
- Specify the sender’s mail address of the mail that will be sent.
- Destination (To)
- Enter the sender’s mail address of the mail that will be sent.
- You can register up to four items; the mail is sent to all of the registered mail addresses.
- You can use up to 64 single-byte characters. However, you cannot use symbols other than underline (_), hyphen (-), dot (.), and at-sign (@).
- Subject
- Specify the subject of the mail that will be sent.
- You can use up to 128 single-byte characters.
- If you select “Use specified subject,” the subject name will be the specified subject.
- Notification content
- The contents of the notification are specified as follows.
- LAN map error detection
- This notification will be made only if this unit is operating as an L2MS master.
- Status notification for terminal monitoring
- The change in status monitored by the device monitoring function will be notified.
- Stack error detection
- Failure information of the stack function will be notified.
- LAN map error detection
- The contents of the notification are specified as follows.
- Mail transmission wait time
- Specify the time by which mail transmission is delayed after the notification event occurs.
- If other notification events occur during this wait time, those notifications are combined and sent in a single email.
- SWR2310 Series Technical Data (GUI)
- Detailed settings
- Terminal monitoring
Terminal monitoring
1. Summary
On this page you can make settings for device monitoring.
The device communication status can be monitored by specifying the monitoring target and method.
You can also specify the action to be executed when the device status changes.
Device monitoring settings can be made only from the Web GUI.
Although the contents of the device monitoring settings are not shown in the CONFIG file, when an operation (such as “erase startup-config”) is performed on the CONFIG file, the same operation is performed on the device monitoring settings.
2. Top page
This is the top page for device monitoring.
List of monitored terminals
- The device monitoring status and settings are shown here.
- The table items are explained below.
- Check box
- Select the check box to delete device monitoring settings.
- Status
- One of the device monitoring statuses as follows are displayed.
- IDLE
- UP
- DOWN
- Refer to 4. Conditions for determining monitored device status for the conditions used to determine the above statuses.
- One of the device monitoring statuses as follows are displayed.
- Include in monitoring
- Displays information for the monitoring target(s).
- If the monitoring type is “Ping”, the IP address of the monitored device will be displayed.
- For monitoring types other than “Ping”, the interface number will be displayed.
- Device name
- Displays the name of the device being monitored.
- Monitoring type
- Displays one of the following monitoring types for the device being monitored.
- Ping
- Frame reception volume
- LLDP
- Displays one of the following monitoring types for the device being monitored.
- Check box
- Press the [New] button to display a page where you can create new settings for monitored devices.
- Press the [Setting] button to access a page where you can change the settings of the selected device.
- Press the [Update] button to update the table.
- If you press the [Delete] button, all monitored devices whose check boxes are selected will be deleted.
- Up to 256 monitored devices can be configured.
- Of these, up to 64 monitored devices with ping can be configured.
3. Monitored device settings page
This page is for configuring the monitored device settings.
Enter the settings, and then press the [Confirm] button.
If there are no mistakes in the input content of the confirmation screen, press the [OK] button.
Setting monitored devices
- Device name
- Specifies the device name.
- Characters that can be inputted include single-byte alphanumeric characters and symbols, excluding ?.
- Up to 80 characters can be inputted.
- Monitoring type
- Select from one of the following monitoring methods.
- Specifying an IP address
- Specify port
- This item cannot be changed when changing the settings.
- Select from one of the following monitoring methods.
- Destination IP address for ping
- Specifies the IP address to which a ping message will be transmitted.
- This item will only be displayed when Specify IP address is selected for the “Monitoring type” item.
- Time waiting for reply
- Specifies the time required to determine whether the ping response has failed.
- The input range is 1 - 60.
- This item will only be displayed when Specify IP address is selected for the “Monitoring type” item.
- No. of failures before detecting unavailable device
- Specifies the number of times that the ping response must fail before determining that the monitored device is unavailable.
- The input range is 1 - 100.
- This item will only be displayed when Specify IP address is selected for the “Monitoring type” item.
- Port
- Specifies the port for frame monitoring.
- The input format is portX.YY.
- This item will only be displayed when Specify port is selected for the “Monitoring type” item.
- Frame monitoring type
- Select from one of the following frame monitoring types.
- Frame reception volume monitoring
- LLDP monitoring
- This item will only be displayed when Specify port is selected for the “Monitoring type” item.
- This item cannot be changed when changing the settings.
- Select from one of the following frame monitoring types.
- Monitor start band
- Specifies the bandwidth at which frame reception volume monitoring will start.
- The input range is 1 - 1000000000.
- This item will only be displayed when Frame monitoring type is selected for the “Frame monitoring type” item.
- Unavailable device detection band
- Specifies the band value for determining that the monitored device is unavailable.
- The input range is 0 - 999999999.
- The value specified for this item must be less than the value used for “Monitor start band”.
- This item will only be displayed when Frame monitoring type is selected for the “Frame monitoring type” item.
- Operation when detecting change in status
- SNMP trap transmission
- When a change of status is detected, a trap is notified to the SNMP manager.
- Mail notification
- An e-mail is sent when a change of status is detected.
- The e-mail server, destination and so on must be configured in order to send e-mail.
- Further, you must select the Status notification for device monitoring in the “Mail notification settings” as the “notification content”.
- Configure the e-mail server and e-mail template on the E-mail notifications page.
- SNMP trap transmission
4. Conditions for determining monitored device status
This explains the conditions for when the monitored device status changes.
- Monitoring with Ping
- If a Ping packet transmitted by this unit does not return within the set time waiting for reply, this is counted as one failure, The status is determined by how many failures occur.
- The conditions for change in status are shown below.
- IDLE status
- Initial status determination has not been completed after setting the monitored device.
- UP status
- Ping transmission has not failed continuously for the no. of failures before detecting unavailable device that was set.
- DOWN status
- Ping transmission fails continuously for the no. of failures before detecting unavailable device that was set.
- IDLE status
- Monitoring according to frame reception volume
- Measures the frame reception volume for the monitoring target and determines the status.
- The conditions for change in status are shown below.
- IDLE status
- After the monitored device is configured, the frame reception volume for the monitored target port has not once exceeded the monitor start band that was set.
- UP status
- After the frame reception volume for the monitored target port exceeded the monitor start band that was set, it did not fall below the unavailable device detection band.
- The frame reception volume for the monitored target port rose above the unavailable device detection band in DOWN status.
- DOWN status
- The frame reception volume for the monitored target port fell below the unavailable device detection band in UP status.
- IDLE status
- Monitoring with LLDP
- Status is determined by the LLDP frame reception status at the monitored target port.
- The conditions for change in status are shown below.
- IDLE status
- After the monitored device is configured, no LLDP frames have been received at the monitored target port.
- UP status
- The next LLDP frame was able to be received at the monitored target port, within the TTL of the previously accepted LLDP frame.
- An LLDP frame could be received in DOWN status at the monitored target port.
- DOWN status
- The next LLDP frame could not be received at the monitored target port, within the TTL of the previously accepted LLDP frame.
- IDLE status
- SWR2310 Series Technical Data (GUI)
- Management
- Unit settings
Unit settings
1. Summary
You can make settings related to date and time of the unit.
2. Top page
This is the top page for this unit’s settings. The current date and time, time zone setting, and date and time synchronization setting are shown.
Time zone setting
The time zone setting is shown.
- Press the [Setting] button to access a page where you can change the settings.
Current date and time setting
The current date and time specified for this unit are shown.
- Press the [Setting] button to access a page where you can change the settings.
Date and time synchronization setting
The NTP server that is queried at the specified time and date synchronization interval is shown.
- Press the [Next] button to access a page where you can synchronize the time.
- Press the [Setting] button to access a page where you can change the settings.
3. Time zone setting page
In this page you can set the time zone.
When you have entered the settings, press the [Confirm] button. If there are no mistakes in the input content confirmation screen, press the [OK] button.
Time zone setting
- Time zone
- Select the time zone from the following.
- UTC
- JST
- Difference from GMT ( -12:00 to +13:00 )
- Select the time zone from the following.
4. Current date and time setting page
In this page you can set the current date and time.
When you have entered the settings, press the [Confirm] button. If there are no mistakes in the input content confirmation screen, press the [OK] button.
Current date and time setting
- Current time
- In the “year/month/date” box, enter the date in YYYY/MM/DD format.
- When you move the focus to the box, a calendar is displayed. You can select a date to enter that date in the box.
- You can also enter this manually.
- In the “hours:minutes:seconds” box, enter the time in hh:mm:ss format.
- When you move the focus to the box, a calendar is displayed. You can select a date to enter that date in the box.
- You can also enter this manually.
- In the “year/month/date” box, enter the date in YYYY/MM/DD format.
5. Date and time synchronization page
In this page you can synchronize the time with an NTP server.
When you press the [OK] button, the time is synchronized with the NTP server that is specified as the query destination.
6. Date and time synchronization setting page
In this page you can make settings for synchronization with an NTP server.
When you have entered the settings, press the [Confirm] button. If there are no mistakes in the input content confirmation screen, press the [OK] button.
Date and time synchronization setting
- Date and time synchronization interval
- Specifies the interval at which time is synchronized with the NTP server.
- You can choose from the following as the synchronization interval.
- Unused
- 1 hour - 24 hours
- The default value is 1 hour
- NTP server to query
- Enter the host name or IP address of the NTP server that will perform synchronization.
- Up to two NTP servers can be configured.
- SWR2310 Series Technical Data (GUI)
- Management
- Access management
User settings
1. Summary
This page is for configuring the user settings.
2. Top page
This is the top page for the user settings.
Password settings
- Password-related settings are displayed.
- The table items are explained below.
- Administrator password
- Displays whether the administrator password has been set.
- Login password
- Displays whether the login password has been set.
- Encryption
- The display will show whether password encryption is enabled.
- Administrator password
- Press the [Setting] button to access the page where you can change the password-related settings.
User settings
- Displays a list of user settings.
- The table items are explained below.
- Check box
- Select the check box to delete user settings.
- User name
- Displays the user name.
- Password
- Displays whether the administrator password has been set.
- Administrative privileges
- Displays whether the user has been given administrative privileges.
- Check box
- Press the [New] button to display the page where you can set up a new user.
- Press the [Setting] button to access a page where you can change the settings of the selected user.
- If you press the [Delete] button, all users whose check boxes are selected will be deleted.
- Settings can be made for up to 32 users.
3. Password settings page
This page is for making password-related settings.
Enter the settings, and then press the [Confirm] button.
If there are no mistakes in the input content of the confirmation screen, press the [OK] button.
Password settings
- Administrator password
- Enter the administrative password that you want to set.
- If the password is not changed, select the Administrator password not changed check box.
- If a password has already been set, the Administrator password not changed check box will be selected by default.
- Refer to the password strength when deciding on your password, which is displayed as you type.
- The strength of the password is indicated in four levels from “weakest” to “strongest” based on the following conditions.
- Number of characters
- Types of characters
- Uppercase alphanumeric characters included
- Lowercase alphanumeric characters included
- Numerals included
- Symbols included
- Administrator password ( confirm )
- To confirm the password that you entered in the “Administrator password” field, enter the password once again.
- Login password
- Specify the login password that you want to set.
- The operation for Login password not changed is the same as the “Administrator password” item.
- The operation for password strength is the same as the “Administrator password” item.
- Login password ( confirm )
- To confirm the password that you entered in the “Login password” item, enter the password once again.
- Encrypt password
- Select the password encryption settings from the settings shown below.
- Encrypt
- Don’t encrypt
- You cannot restore a password that has been encrypted.
- The settings for this field will affect the following passwords.
- Administrator password
- Login password
- User passwords
- Select the password encryption settings from the settings shown below.
4. User settings page
This page is for configuring the user settings.
Enter the settings, and then press the [Confirm] button.
If there are no mistakes in the input content of the confirmation screen, press the [OK] button.
User settings
- User name
- When configuring new settings
- Specifies the user name to set.
- Single-byte alphanumeric characters can be inputted.
- Up to 32 characters can be inputted.
- The following text strings cannot be set.
- lp
- adm
- bin
- ftp
- gdm
- man
- rpc
- sys
- xfs
- halt
- news
- nscd
- sync
- uucp
- root
- games
- daemon
- gopher
- nobody
- ftpuser
- mtsuser
- rpcuser
- mailnull
- operator
- shutdown
- When changing settings
- Shows the selected user name.
- When configuring new settings
- New password
- Enter the new password that you want to set.
- The operation for password strength is the same as the “Administrator password” item in the Password settings page.
- New password ( confirm )
- To confirm the password that you entered in the “New password” item, enter the password once again.
- Administrative privileges
- Select from one of the following administrative privileges.
- Do not set
- Set
- Users that have been given administrative privileges can log in as an administrative user when logging into the Web GUI.
- Select from one of the following administrative privileges.
- SWR2310 Series Technical Data (GUI)
- Management
- Access management
- Various server settings
Various server settings
1. Summary
In this page you can make settings for each type of server.
2. Top page
This is the top page for making settings for each type of server.
The current settings are shown for the servers listed below.
- HTTP server
- Telnet server
- SSH server
- TFTP server
Web GUI access
- Displays the settings for the HTTP server.
- The table items are explained below.
- Use HTTP server
- Displays whether an HTTP server is to be used or not.
- If an HTTP server is to be used, the port number will be displayed.
- Use secure HTTP server
- Displays whether a secure HTTP server is to be used or not.
- If a secure HTTP server is to be used, the port number will be displayed.
- Interfaces that can access the HTTP server
- Displays the interfaces that can access the HTTP server.
- You can access a management VLAN without server settings.
- Clients that can access the HTTP server
- Displays the clients that can access the HTTP server.
- Use HTTP proxy
- Displays whether an HTTP proxy server is to be used or not.
- If an HTTP proxy server is to be used, the timeout interval is displayed.
- Use HTTP server
Access via Telnet
- Displays the settings for the Telnet server.
- The table items are explained below.
- Use Telnet server
- Displays whether a Telnet server is to be used or not.
- If a Telnet server is to be used, the port number will be displayed.
- Interfaces that can access the Telnet server
- Displays the interfaces that can access the Telnet server.
- You can access a management VLAN without server settings.
- Clients that can access the Telnet server
- Displays the clients that can access the Telnet server.
- Use Telnet server
Access via SSH
- Displays the settings for the SSH server.
- The table items are explained below.
- Use SSH server
- Displays whether an SSH server is to be used or not.
- If an SSH server is to be used, the port number will be displayed.
- Interfaces that can access the SSH server
- Displays the interfaces that can access the SSH server.
- You can access a management VLAN without server settings.
- Clients that can access the SSH server
- Displays the clients that can access the SSH server.
- Client existence check from SSH server
- Displays whether the SSH server checks for existing clients.
- If the SSH server is set to check for existing clients, this displays the check interval and the number of times checked before disconnecting.
- Use SSH server
Access via TFTP
- Displays the settings for the TFTP server.
- The table items are explained below.
- Use TFTP server
- Displays whether a TFTP server is to be used or not.
- If a TFTP server is to be used, the port number will be displayed.
- Interfaces that can access the TFTP server
- Displays the interfaces that can access the TFTP server.
- You can access a management VLAN without server settings.
- Use TFTP server
3. Web GUI access page
In this page you can configure the settings for an HTTP server.
Enter the settings, and then press the [Confirm] button.
If there are no mistakes in the input content of the confirmation screen, press the [OK] button.
Web GUI access
- Use HTTP server
- Select below whether an HTTP server will be used or not.
- Use
- Don’t use
- When “Use” is selected, specify the port number.
- Input a port number from 1 to 65535.
- Select below whether an HTTP server will be used or not.
- Use secure HTTP server
- Select below whether an secure HTTP server will be used or not.
- Use
- Don’t use
- When “Use” is selected, specify the port number.
- Input a port number from 1 to 65535.
- Select below whether an secure HTTP server will be used or not.
- Interfaces that can access the HTTP server
- Press the [Select] button to display the “VLAN interface list” dialog box.
- You can select the port check box in the “VLAN interface list” dialog box and press the [Confirm] button to select the associated interface.
- Up to 8 VLAN interfaces can be selected.
- Clients that can access the HTTP server
- Select the client access restriction methods from the following options.
- Permit all
- Specify conditions
- When “Specify conditions” is selected, up to 8 conditions can be specified.
- The conditions are specified as shown below.
- Operation
- To restrict client access, select from the following operations.
- Permit
- Deny
- To restrict client access, select from the following operations.
- Conditional
- Select from the following targets for client access restriction.
- All addresses
- Specified IP address
- Select from the following targets for client access restriction.
- IP address
- When “Specified IP address” is selected, specify the IP address.
- The following IP addresses shown below can be specified.
- IPv4 address
- Example: 192.168.100.1
- IPv4 network address
- Example: 192.168.100.0/24
- IPv6 address
- Example: fe80::1234:5678
- IPv6 network address
- Example: 2001:1234:5678:90ab::0/64
- IPv4 address
- Operation
- Press the
- Press the [Delete] button to delete a configuration form.
- Select the client access restriction methods from the following options.
- Use HTTP proxy
- Select below whether an HTTP proxy server will be used or not.
- Use
- Don’t use
- When “Use” is selected, specify the timeout interval.
- Input a timeout interval from 1 to 180.
- Select below whether an HTTP proxy server will be used or not.
 icon to add a configuration form.
4. Access via Telnet page
In this page you can configure the settings for a Telnet server.
Enter the settings, and then press the [Confirm] button.
If there are no mistakes in the input content of the confirmation screen, press the [OK] button.
Access via Telnet
- Use Telnet server
- Select below whether a Telnet server will be used or not.
- Use
- Don’t use
- When “Use” is selected, specify the port number.
- Input a port number from 1 to 65535.
- Select below whether a Telnet server will be used or not.
- Interfaces that can access the Telnet server
- The setting method for this item is the same as for the “Interfaces that can access the HTTP server” item on the Web GUI access page.
- Clients that can access the Telnet server
- The setting method for this item is the same as for the “Clients that can access the HTTP server” item on the Web GUI access page.
5. Access via SSH page
In this page you can configure the settings for an SSH server.
Enter the settings, and then press the [Confirm] button.
If there are no mistakes in the input content of the confirmation screen, press the [OK] button.
If a host key has not been generated for the SSH server, the host key will be automatically generated when you modify the settings for using the SSH server.
Access via SSH
- Use SSH server
- Select below whether an SSH server will be used or not.
- Use
- Don’t use
- When “Use” is selected, specify the port number.
- Input a port number from 1 to 65535.
- Select below whether an SSH server will be used or not.
- Interfaces that can access the SSH server
- The setting method for this item is the same as for the “Interfaces that can access the HTTP server” item on the Web GUI access page.
- Clients that can access the SSH server
- The setting method for this item is the same as for the “Clients that can access the HTTP server” item on the Web GUI access page.
- Client existence check from SSH server
- Select below whether the SSH server checks for existing clients.
- Check
- Do not check
- When “Check” is selected, specify the check interval and the number of times checked before disconnecting.
- Input a check interval from 1 to 2147483647.
- Input the number of times checked from 1 to 2147483647.
- Select below whether the SSH server checks for existing clients.
6. Access via TFTP page
In this page you can configure the settings for a TFTP server.
Enter the settings, and then press the [Confirm] button.
If there are no mistakes in the input content of the confirmation screen, press the [OK] button.
Access via TFTP
- Use TFTP server
- Select below whether a TFTP server will be used or not.
- Use
- Don’t use
- When “Use” is selected, specify the port number.
- Input a port number from 1 to 65535.
- Select below whether a TFTP server will be used or not.
- Interfaces that can access the TFTP server
- The setting method for this item is the same as for the “Interfaces that can access the HTTP server” item on the Web GUI access page.
- SWR2310 Series Technical Data (GUI)
- Management
- External devices
microSD
1. Summary
On this page you can perform operations with the microSD card.
The microSD card will automatically be mounted when it is inserted into this unit.
When removing the microSD card from this unit while the unit is powered on, be sure to unmount the microSD card first.
If the stack function is enabled, you can perform operations with the microSD card that is inserted to the master stack.
2. Top page
This is the microSD top page.
Displays the mounting status of the microSD card.You can also begin the steps here for switching the mounting status of the microSD card.
Mounting switch for microSD card
- Displays the mounting status of the microSD card.
- Press the [Next] button to begin the steps for switching the mounting status of the microSD card.
3. microSD card mounting switch page
This page is for switching the microSD card mounting status.
Press the [OK] button to switch the mounting status of the microSD card.
If the microSD card is already mounted, it will be unmounted; and if the microSD card is already unmounted, it will be mounted.
- SWR2310 Series Technical Data (GUI)
- Management
- Dante optimization
Dante optimization
1. Summary
This is the page for operations related to the Dante optimization settings.
The Dante optimization settings can be made manually or by means of auto-configure via LLDP.
By configuring the optimization settings, the following functions will be set.
- DiffServ base QoS
- IGMP snooping
- Flow control
- EEE
2. Top page
This is the top page for configuring the Dante optimization.
Manual settings
- Press [Next] button to begin the steps for Dante optimization settings.
Auto-configure via LLDP
- The current settings for the auto-configure via LLDP function are displayed.
- Press [Setting] button to display the page where the settings for the auto-configure via LLDP function can be modified.
3. Manual settings page
This is the page for the Dante optimization settings.
Press [OK] button to apply the optimization settings.
4. Auto-configure via LLDP page
This is the page for setting auto-configure via LLDP.
Enter the settings, and then press the [Confirm] button.
If there are no mistakes in the input content of the confirmation screen, press the [OK] button.
Auto-configure via LLDP
- Auto-configure via LLDP
- Select whether to enable the auto-configure via LLDP settings, from the options below.
- Enable
- Disable
- Select whether to enable the auto-configure via LLDP settings, from the options below.
- SWR2310 Series Technical Data (GUI)
- Management
- Maintenance
- Command execution
Command execution
1. Summary
In this page you can perform operations related to command execution.
2. Command execution page
In this page you can execute commands and acquire the results of command execution. After entering the command in the command entry field, press the [OK] button to execute the command. If you press the [Clear] button, the contents of the command entry field are cleared.
Command execution
- Command input
- In the command entry field, enter the setting in console command format (abbreviated input is not accepted).
- You can enter multiple commands together by separating them with line-returns.
- Execution always starts with the specially-privileged EXEC mode (enable). Enter the mode change command each time.
- For details on commands to enter, refer to the command reference and to the information provided on the Network device product information page and Network device technical information page.
- The following commands cannot be entered.
- ping
- ping6
- telnet
- ssh
- ssh-server host key generate
- do
- reload
- cold start
- firmware-update execute
- firmware-update sd execute
- startup-config select
- erase startup-config
- copy running-config startup-config
- copy startup-config
- show startup-config
- show history
- show tech-support
- backup system
- restore system
- remote-login
- stack enable
- stack disable
- no stack
- boot prioritize sd
- no boot prioritize sd
- quit
- disable
- logout
- exit ( When in special privilege EXEC mode )
- Command execution result
- Displays the command execution result.
- Success ... Shown if the command executed successfully.
- Error ... Shown if the command you entered could not be executed.
- Prohibited ... Shown if a prohibited command was entered.
- Displays the command execution result.
- Command execution log
- The console log is output as the command execution record.
- The command execution log will not necessarily always show the identical result as when the console setting operation was executed.
- By pressing the [Obtain as text file] button, you can acquire the contents of the command execution log as a text file.
- The name of the acquired file is “command_YYYYMMDDhhmmss.txt”.
YYYY ... A.D. ( 4 Digit ) MM ... Month ( 2 Digit ) DD ... Day ( 2 Digit ) hh ... Hours ( 2 Digit ) mm ... Minutes ( 2 Digit ) ss ... Seconds ( 2 Digit )
- SWR2310 Series Technical Data (GUI)
- Management
- Maintenance
- Update firmware
Update firmware
1. Summary
In this page you can perform operations related to firmware update.
2. Top page
This is the top page for firmware update.
You can start the procedure for updating the firmware via the network. Various settings for updating the firmware via the network are displayed.
Current firmware revision
- The currently-used firmware revision is shown.
Update firmware from PC
- When you press the [Next] button, the procedure for updating the firmware from the PC will be started.
Update firmware via network
- When you press the [Next] button, the procedure for updating the firmware via the network will be started.
- Various settings for updating the firmware via the network are displayed.
- Press the [Setting] button to access a page where you can change the settings.
3. Update firmware from PC page
In this page you can specify the firmware file placed on the PC from which you are accessing the Web GUI, and perform the firmware update.
In “Select file,” select the firmware file that you want to use for the update, and press the [Confirm] button. If there are no mistakes in the confirmation screen, press the [OK] button.
Note that the unit will automatically restart when the firmware has been updated successfully.
Update firmware from PC
- Specify update file
- Selects the firmware file used for the update
4. Update firmware via network page
In this page you can download a firmware file from a web server, and perform the firmware update. This function lets you easily perform the entire process of checking for the latest firmware, downloading it, and updating the firmware.
When you open the page, the revision of the firmware file on the web server is automatically checked.
If the URL of the download source is a Yamaha website, and an updatable firmware revision is found, pressing the [OK] button will display the software license agreement. Carefully read the software license agreement, and press either the [Agree] button or [Disagree] button. Only if you press the [Agree] button, the firmware file will start being downloaded from the web server.
Note that the unit will automatically restart when the firmware has been updated successfully.
The firmware cannot be updated over the network if the stack function is enabled.
Update firmware via network
- Current firmware revision
- The revision of the currently-used firmware file is shown.
- Firmware revision available for update
- Updatable revisions of the firmware files on the web server are shown.
5. Firmware update basic settings page
In this page you can make various settings for updating the firmware via the network.
When you have entered the settings, press the [Confirm] button. If there are no mistakes in the input content confirmation screen, press the [OK] button.
Firmware update basic settings
- Download source URL
- This is the setting of the URL at which the firmware is located.
- Permit downward revision
- This setting permits or forbids rewriting to an older version of firmware.
- Timeout
- This setting specifies the timeout time during the process of updating the firmware via the network.
- SWR2310 Series Technical Data (GUI)
- Management
- Maintenance
- CONFIG management
CONFIG management
1. Summary
In this page you can import and export CONFIG.
This unit operates in accordance with its CONFIG file (settings data). A CONFIG file consists of a combination of multiple commands.
2. Top page
This is the top page for CONFIG management.
You can start the process of importing a CONFIG, or the process of exporting a CONFIG.
Import
- Press the [Next] button to display a page where you can import a CONFIG.
Export
- Press the [Next] button to display a page where you can export a CONFIG.
3. Import page
In this page, a CONFIG from the PC can be copied to internal non-volatile memory, updating the CONFIG.
When you have entered the settings, press the [Confirm] button. If there are no mistakes in the input content confirmation screen, press the [OK] button.
If the currently used CONFIG is the same as the import-destination CONFIG, the unit restarts automatically after the import has ended successfully.
If you want to start up with a CONFIG file that is not currently being used, change the setting using the startup-config select command before restarting.
Import CONFIG
- Import method
- Select the import method from the following options.
- Import all settings (.zip)
- Import information such as a CONFIG file and a L2MS slave CONFIG together.
- You cannot be used when using YNO manager for access.
- Import a CONFIG file (.txt)
- Import a CONFIG file.
- Import a L2MS slave CONFIG (.bin)
- Import a L2MS slave CONFIG.
- Settings to import
- Press the [Select a file] button to display the file selection dialog box.
- You can use the settings obtained on the export page.
- Import-destination
- Select the import-destination CONFIG in internal non-volatile memory.
4. Export page
In this page you can copy a CONFIG from internal non-volatile memory to the PC.
When you have finished entry, check the entered content and press the [OK] button.
Export CONFIG
- Export method
- Select the export method from the following options.
- Export all settings (.zip)
- Export information such as a CONFIG file and a L2MS slave CONFIG together.
- You cannot be used when using YNO manager for access.
- Export a CONFIG file (.txt)
- Export a CONFIG file.
- Export a L2MS slave CONFIG (.bin)
- Export a L2MS slave CONFIG.
- Settings to export
- Select the CONFIG in internal non-volatile memory that you want to export.
- SWR2310 Series Technical Data (GUI)
- Management
- Maintenance
- Summary data management
Summary data management
1. Summary
This page is for performing operations related to the summary data.
2. Top page
This is the top page for summary data management.
The settings for whether to back up the summary data or not are displayed.
Here you can start the process of clearing the summary data and exporting summary data to a PC.
Backup settings for summary data
- The settings for whether to back up the summary data or not are displayed.
- Press the [Setting] button to access a page where you configure the backup settings.
Clearing summary data
- Press the [Next] button to begin the process of clearing the summary data.
Export summary data
- Press the [Next] button to begin the process of exporting the summary data to a PC.
3. Backup settings page for summary data
This page is for configuring the summary data backup settings.
Enter the settings, and then press the [Confirm] button.
If there are no mistakes in the input content of the confirmation screen, press the [OK] button.
When backup settings are enabled, the summary data will be backed up whenever an SD card has been inserted.
Backup settings for summary data
- Summary data to be backed up
- Select the summary data to back up from the list below.
- Traffic information
- Resource information
- Select the summary data to back up from the list below.
4. Page for clearing summary data
This page is for clearing the summary data.
When you have inputted the settings, press the [Confirm] button.
If there are no mistakes in the input content confirmation screen, press the [OK] button.
When the summary data has been cleared, both the data saved in internal volatile memory and the data backed up to SD card will be cleared.
Clearing summary data
- Summary data to clear
- Select the summary data to clear from one of the following.
- Traffic information
- Resource information
- Select the summary data to clear from one of the following.
5. Export page for summary data
This page is for exporting summary data.
When you have finished inputting, check the inputted content and press the [OK] button.
Implementing the summary data export will download a ZIP file.
Summary data will be exported if an SD card is inserted.
See 6. Export file configuration for more information on the configuration of the ZIP file.
Export summary data
- Summary data to export
- Select the summary data to export from one of the following.
- Traffic information(Transmit)
- Traffic information(Reception)
- Resource information
- Select the summary data to export from one of the following.
- Specifying a timespan
- Select the month(s) of the data to be exported.
- Specify the month(s) from the previous year using the drop-down list box.
6. Export file configuration
This explains about the folder that will be extracted when decompressing the ZIP file.
The configuration when the October 2017 traffic information (received) is exported is shown below.
- 20171103150412_trf_rx_csv.zip
- 20171103150412_trf_rx_csv
- 20171001_trf_rx_hour.csv
- :
- 20171031_trf_rx_hour.csv
- 201710_trf_rx_day.csv
- 20171103150412_trf_rx_csv
This explains about the folder and files after extraction.
- 20171103150412_trf_rx_csv
- The CSV files with the summary data are contained in this folder.
- The time of export and data type are used in the folder name.
- One of the following will be used for the data type, according to the type specified.
- trf_tx
For traffic information (transmission)
- trf_rx
For traffic information (reception)
- resource
For resource information
- trf_tx
- 20171001_trf_rx_hour.csv
- This is the CSV file with the summary data.
- The date, data type and data unit time will be included in the file name for the target data.
- The naming convention for the data type is the same as for the folders.
- One of the following will be used for the data unit time.
- hour
Files that are totaled every hour, containing one days’ worth of data
- day
Files that are totaled every day, containing one months’ worth of data
- hour
- SWR2310 Series Technical Data (GUI)
- Management
- Maintenance
- SYSLOG management
SYSLOG management
1. Summary
In this page you can view and edit the settings of the SYSLOG function.
The operation history of this device is output as the SYSLOG (log data) according to the settings of the SYSLOG function. In addition to recording the SYSLOG inside this device, you can also specify a destination address for output to an external host.
2. Top page
This is the top page for SYSLOG management.
The current settings for the SYSLOG function are shown.
SYSLOG settings
- The type of SYSLOG that is output and the SYSLOG transmission destination address are shown.
- Press the [Setting] button to access a page where you can change the settings.
3. SYSLOG settings page
In this page you can make settings for the SYSLOG function.
When you have entered the settings, press the [Confirm] button. If there are no mistakes in the input content confirmation screen, press the [OK] button.
For details on the various SYSLOG types, refer to the command reference.
SYSLOG settings
- SYSLOG type
- DEBUG
- This setting specifies whether DEBUG type SYSLOG is output.
- INFO
- This setting specifies whether INFO type SYSLOG is output.
- ERROR
- This setting specifies whether ERROR type SYSLOG is output.
- DEBUG
- SYSLOG transmission destination address
- This is the transmission destination address setting when outputting the SYSLOG to an external host.
- You can specify up to two IPv4/IPv6 destination addresses.
- For IPv6 link local addresses, you must also specify the interface to send from. (Format: fe80::X%vlanN)
- If no destination address is specified, the SYSLOG is recorded only inside the switch.
- SWR2310 Series Technical Data (GUI)
- Management
- Maintenance
- Restart and initialization
Restart and initialization
1. Summary
In this page you can restart this unit and return it to the factory-set state.
2. Top page
This is the top page for restart and initialization.
Here you can start the process of restarting this unit or returning it to the factory-set state.
Restart
- When you press the [Next] button, the process of restarting this unit will begin.
Initialization
- When you press the [Next] button, the process of returning this unit to the factory-set state will begin.
3. Restart page
In this page you can restart this unit.
When you press the “OK” button, the unit will restart.
If the stack function is disabled, press the [OK] button to restart the unit.
If the stack function is enabled, select the device to restart from the input screen and press the [Confirm] button. Then, press the [OK] button on the execute screen to restart the specified device.
Note that when you execute restart, the settings that were being changed will not be saved. In addition, the GUI cannot be accessed until restart has completed.
4. Initialization page
In this page you can return this unit to its factory-set state.
After you have entered the administrator password, press the [Confirm] button. Confirm the content to be executed, and if you want to return this unit to its factory-set state, press the [OK] button.
Note that when the unit is returned to its factory-set state, all settings will return to their default values, including the address for accessing the GUI.
If the stack function is enabled, only the master stack is initialized.
Initialization
- Administrator password
- To return the unit to its factory-set state, enter the administrator password.
- SWR2310 Series Technical Data (GUI)
- Management
- GUI display language
GUI display language
1. Summary
Here you can specify the display language.
2. Top page
This is the top page for the Web GUI display language. The contents of the display language settings are shown.
Display language setting
The display language settings are shown.
- Press the [Setting] button to access a page where you can change the settings.
3. Web GUI display language page
In this page you can make settings for the display language.
When input is complete, check the input, and if it is correct, press the [OK] button.
Display language setting
- Language
- Select the display language from the following.
- 日本語 ( Japanese )
- English ( English )