Screen structure
3. Screen structure
3.1. “ProVisionaire Edge Setting” window
The “ProVisionaire Edge Setting” window allows you to configure ProVisionaire Edge.
To open this screen, select the Windows [Start] menu → [Yamaha ProVisionaire Edge] → [ProVisionaire Edge Setting].
3.1.1. Monitoring screen
Configure the network interface and register target devices.
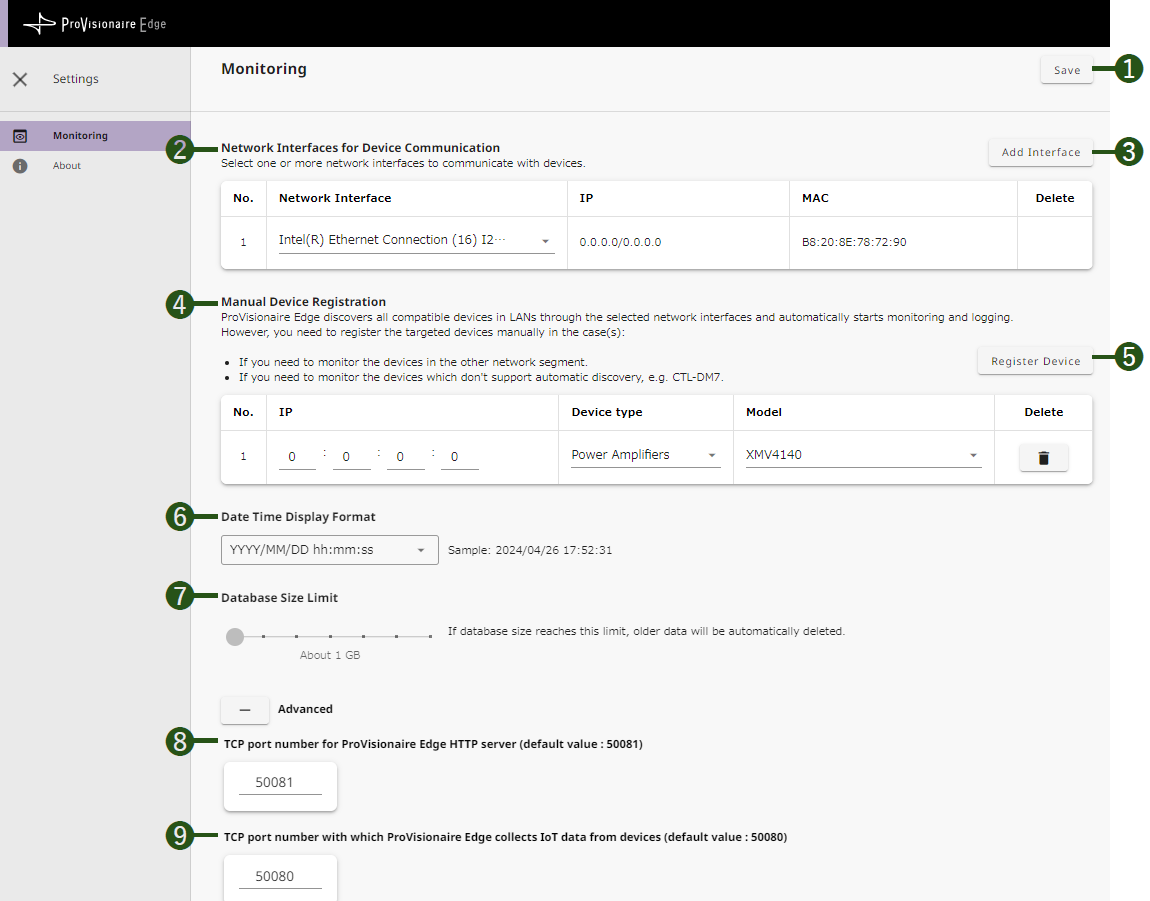
❶ [Save] button
The settings are reflected in ProVisionaire Edge.
❷ [Network Interfaces for Device Communication]
Select the network interface to be used for obtaining device operation information.
❸ [Add Interface] button
Each time you click this button, an interface is added.
❹ [Manual Device Registration]
When monitoring a device that is in a different network segment than ProVisionaire Edge or a device that does not support automatic discovery, specify the IP address of the device and register it as a monitoring target.
❺ [Register Device] button
Each time you click it, a device is added. Set the IP address of the device on the network and the target model.
❻ [Date Time Display Format]
Specify the display time format used in the [Fault & Event List].
❼ [Database Size Limit]
When the database size exceeds the specified size, the oldest data will be automatically deleted.
Advanced settings
❽ [TCP port number for ProVisionaire Edge HTTP server (default value: 50081)]
Set a TCP port number through which to pass monitoring information to other computers.
When you change the TCP port number, change the Windows firewall settings as well.
❾ [TCP port number with which ProVisionaire Edge collects IoT data from devices (default value: 50080)]
Set a TCP port number through which to collect monitoring information.
When you change the TCP port number, change the Windows firewall settings as well.
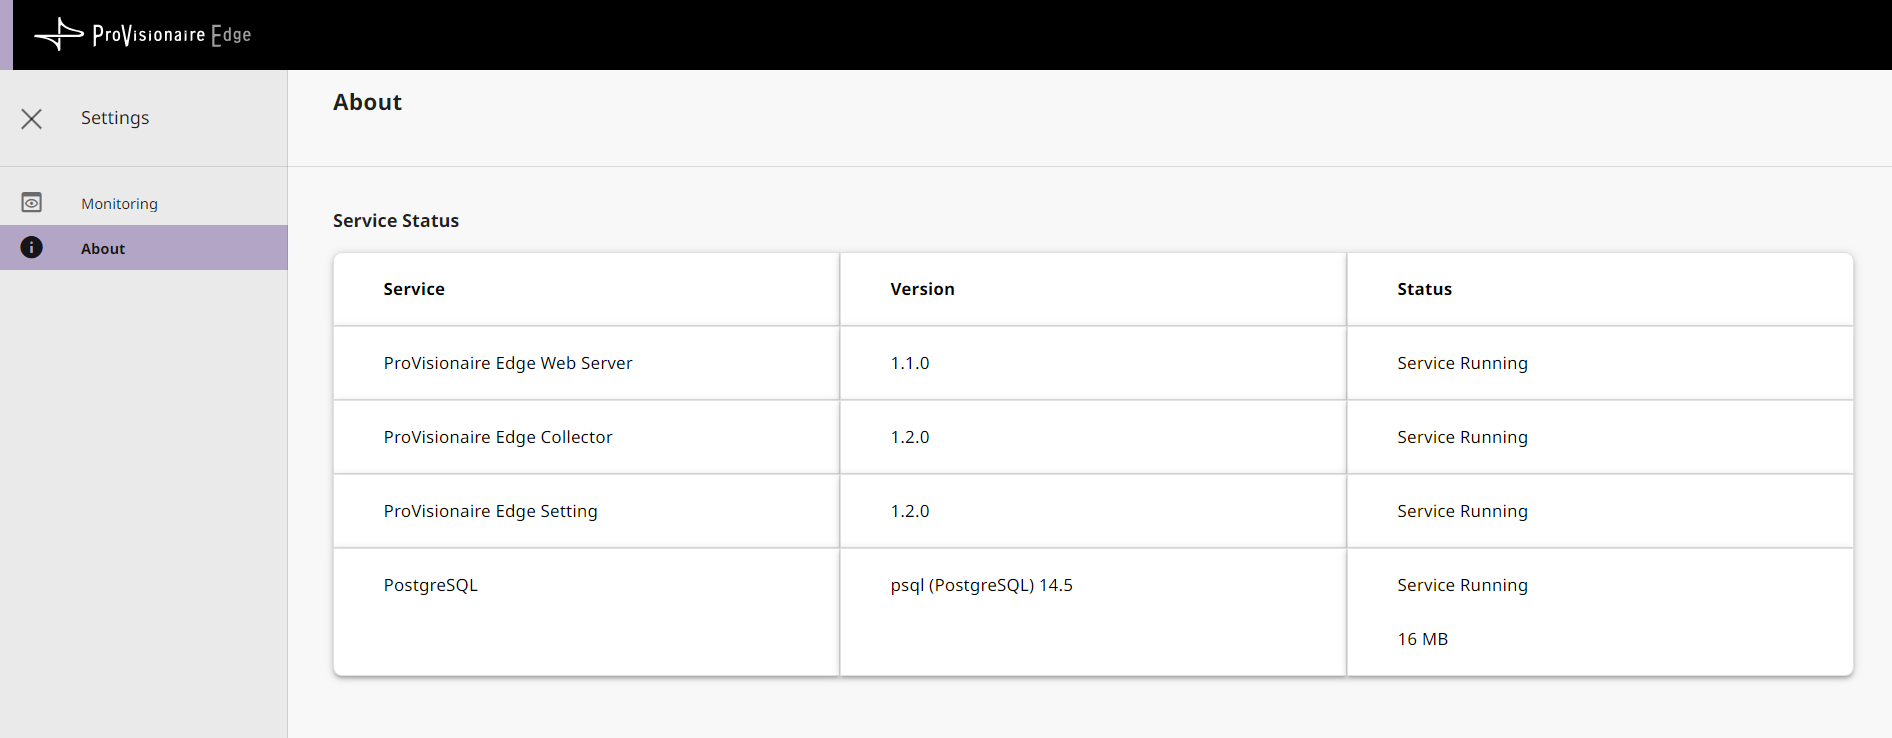
3.1.2. About screen
You can check the version and statuses of the server services that configure the operation of ProVisionaire Edge.
3.2. “ProVisionaire Edge” monitoring window
The “ProVisionaire Edge” monitoring window allows you to monitor the operating statuses of supported devices with ProVisionaire Edge.
To open this screen, select the Windows [Start] menu → [Yamaha ProVisionaire Edge] → [ProVisionaire Edge].
NOTE
To display the latest state, refresh (reload) the page in your browser.
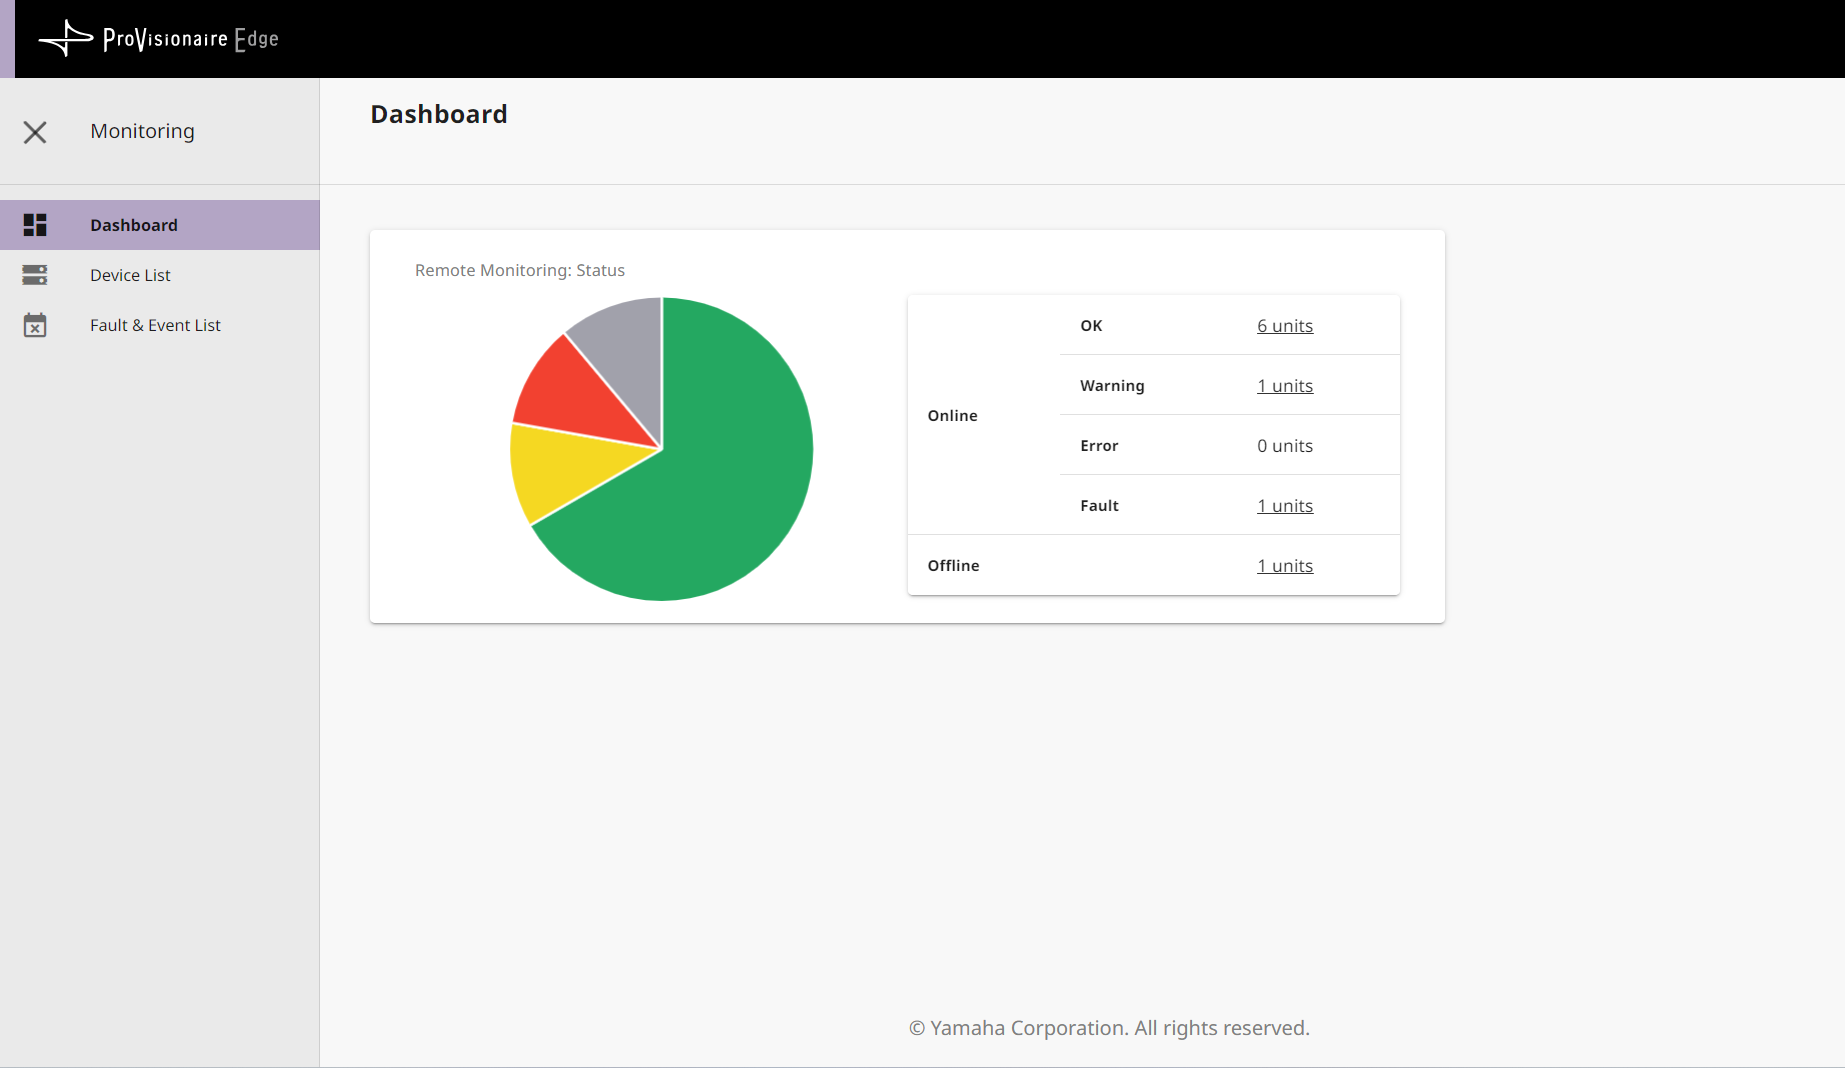
3.2.1. Dashboard screen
This screen displays the overall device statuses (OK, Warning, Error, or Fault).
-
OK : No abnormalities
-
Warning : Automatic avoidance, prevention, protection, or precursor detection by devices
-
Error : Temporary malfunction (cause: incorrect settings, misoperation, incorrect wiring, incorrect management, etc.)
-
Fault : Unrecoverable malfunction (cause: hardware failure, etc.)
3.2.2. Device List screen
This screen displays the device operation information collected by ProVisionaire Edge.
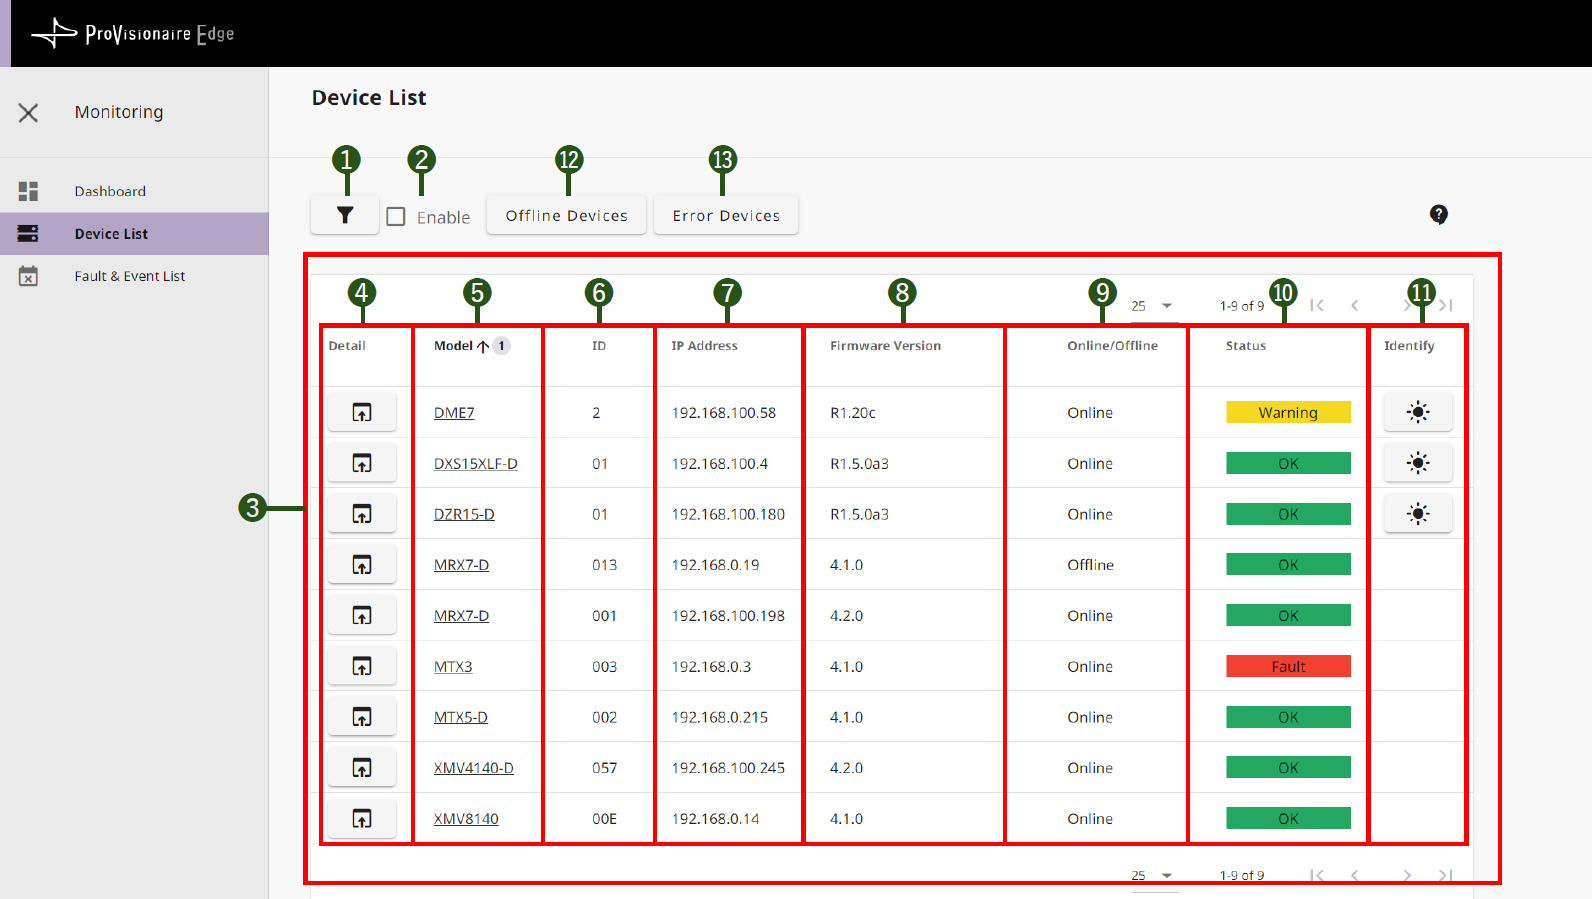
❶ [Filter] button
![]()
The filter settings screen is displayed.
❷ [Enable] checkmark
Select this box to enable the filter.
❸ Device List
-
❹ [Detail] button
Detailed device information is displayed.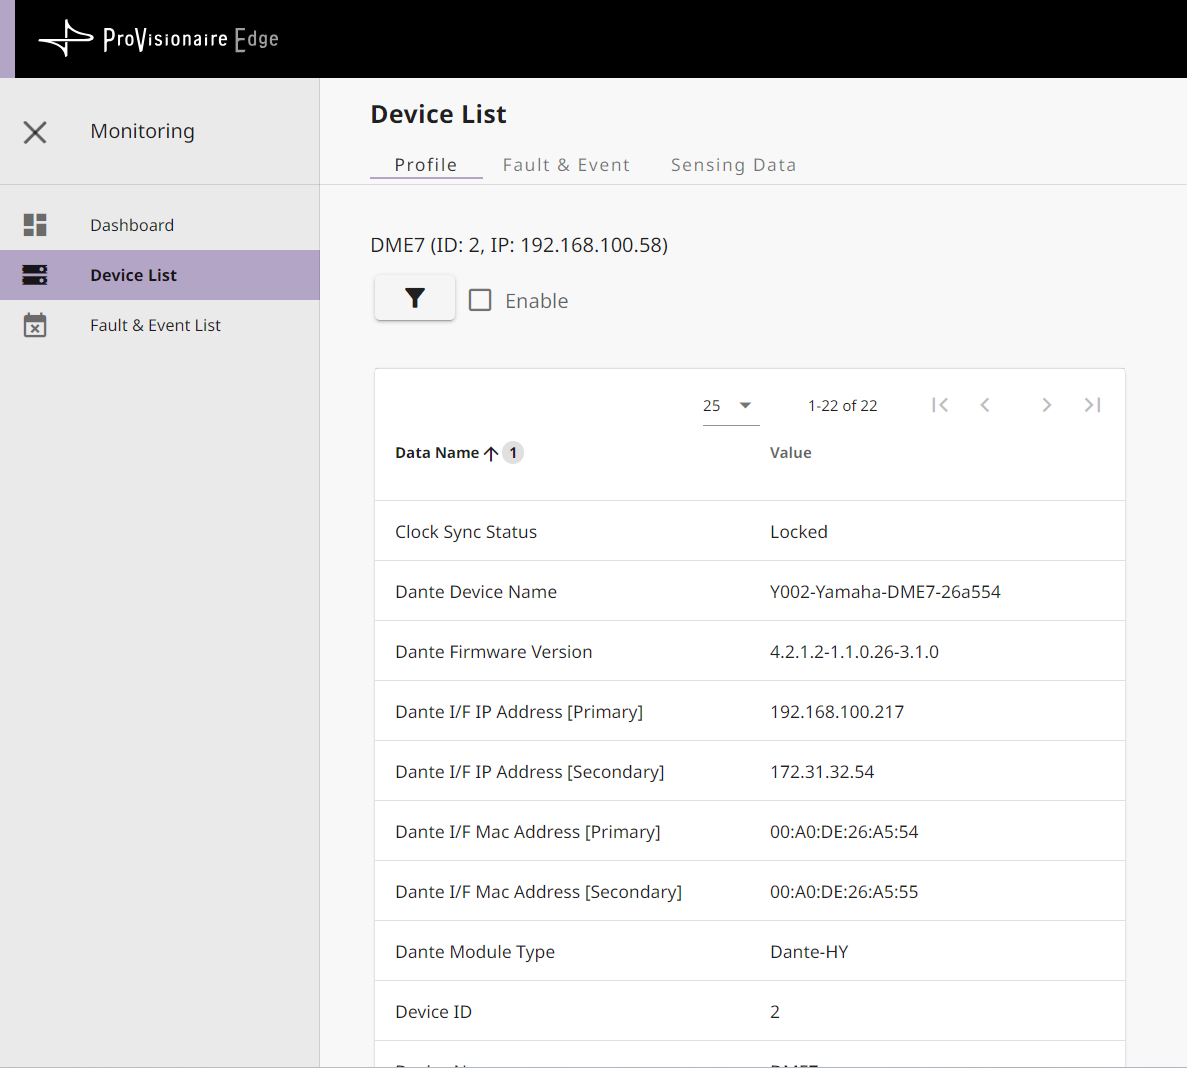
-
❺ Model
Model name of device -
❻ ID
UNIT ID of device -
❼ IP Address
IP address of device -
❽ Firmware Version
MAIN firmware version of device -
❾ Online/Offline
Device connection status (Online/Offline) -
❿ Status
Device status (OK/Warning/Error/Fault) -
⓫ [Identify] button
When you click here, the device indicator flashes for a few seconds.
⓬ [Offline Devices] button
Only offline devices are displayed in the list.
⓭ [Error Devices] button
Only devices with an error are displayed in the list.
3.2.3. Fault & Event List screen
This screen displays a list of information on the faults and events that have occurred on all the monitored devices.
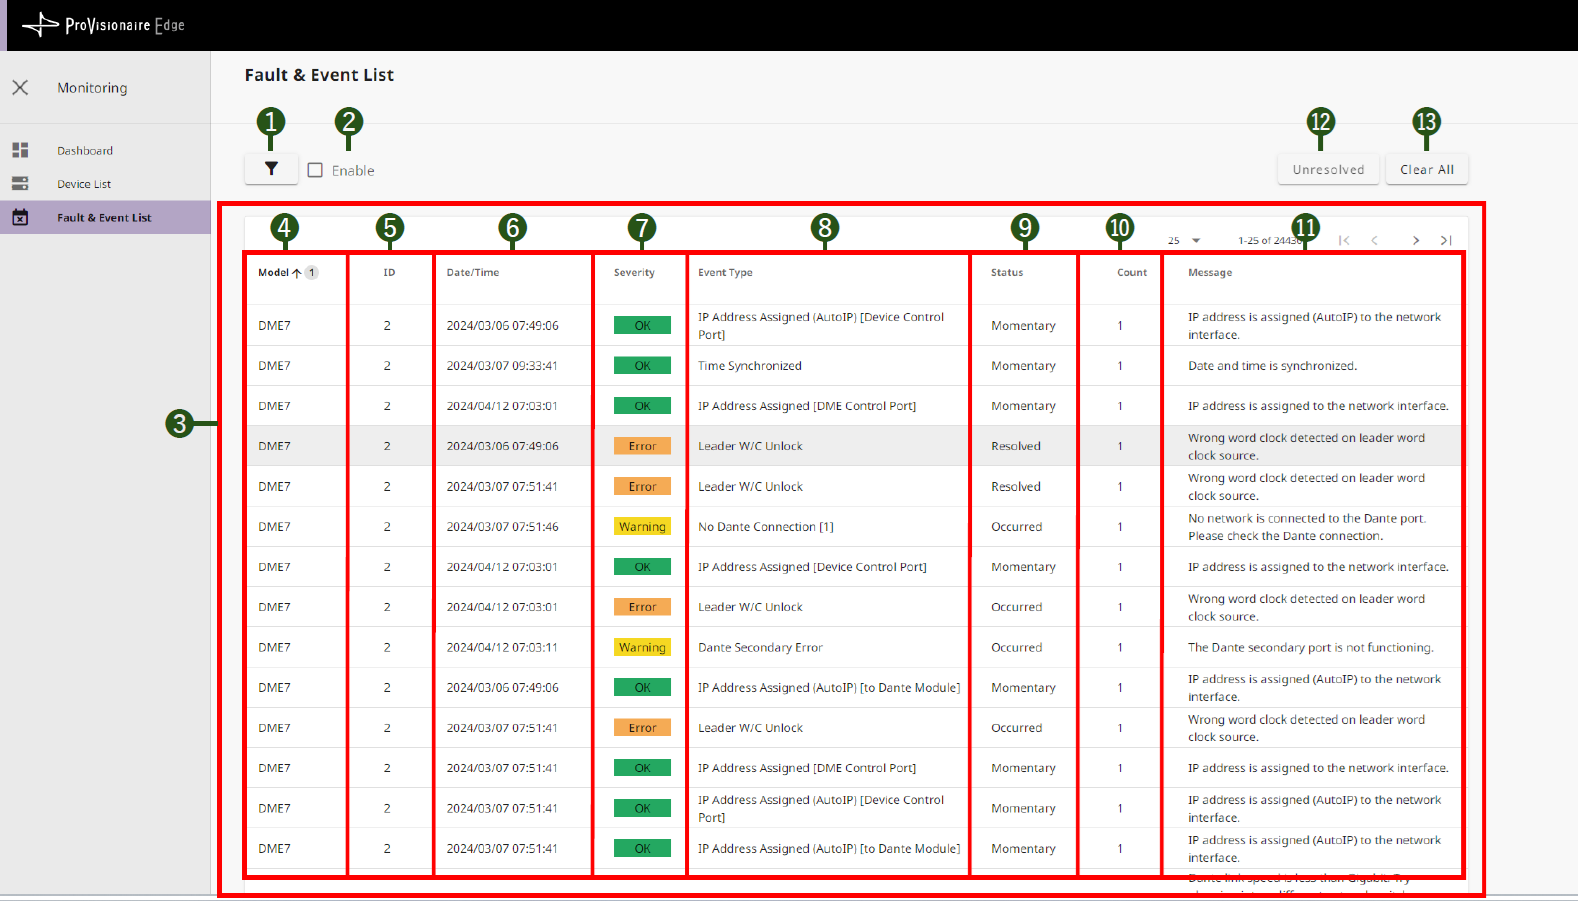
❶ Filter button
![]()
The filter settings screen is displayed.
❷ [Enable] checkmark
Select this box to enable the filter.
❸ Fault & Event List
-
❹ Model
Model name of device -
❺ ID
UNIT ID of device -
❻ Date/Time
Date and time when the fault or event occurred -
❼ Severity
Severity of the fault or event that occurred-
OK : No abnormalities
-
Warning : Automatic avoidance, prevention, protection, or precursor detection by devices
-
Error : Temporary malfunction (cause: incorrect settings, misoperation, incorrect wiring, incorrect management, etc.)
-
Fault : Unrecoverable malfunction (cause: hardware failure, etc.)
-
-
❽ Event Type
Type of event that occurred
-
❾ Status
Type of fault or event that occurred-
Momentary : Event occurrence
-
Occurred : Transition to a faulty state
-
Resolved : Transition to a fault resolved state
-
-
❿ Count
Number of times that the same fault or event occurred before the next fault or event occurred -
⓫ Message
Detailed information about the fault that occurred
⓬ [Unresolved] button
Only faulty devices whose fault is unresolved are displayed.
⓭ [Clear All] button
All logs within ProVisionaire Edge are cleared. A screen appears asking you to confirm whether to clear the logs.