This product provides a mechanism for constantly observing the system’s performance.
An overview of the function is given below.
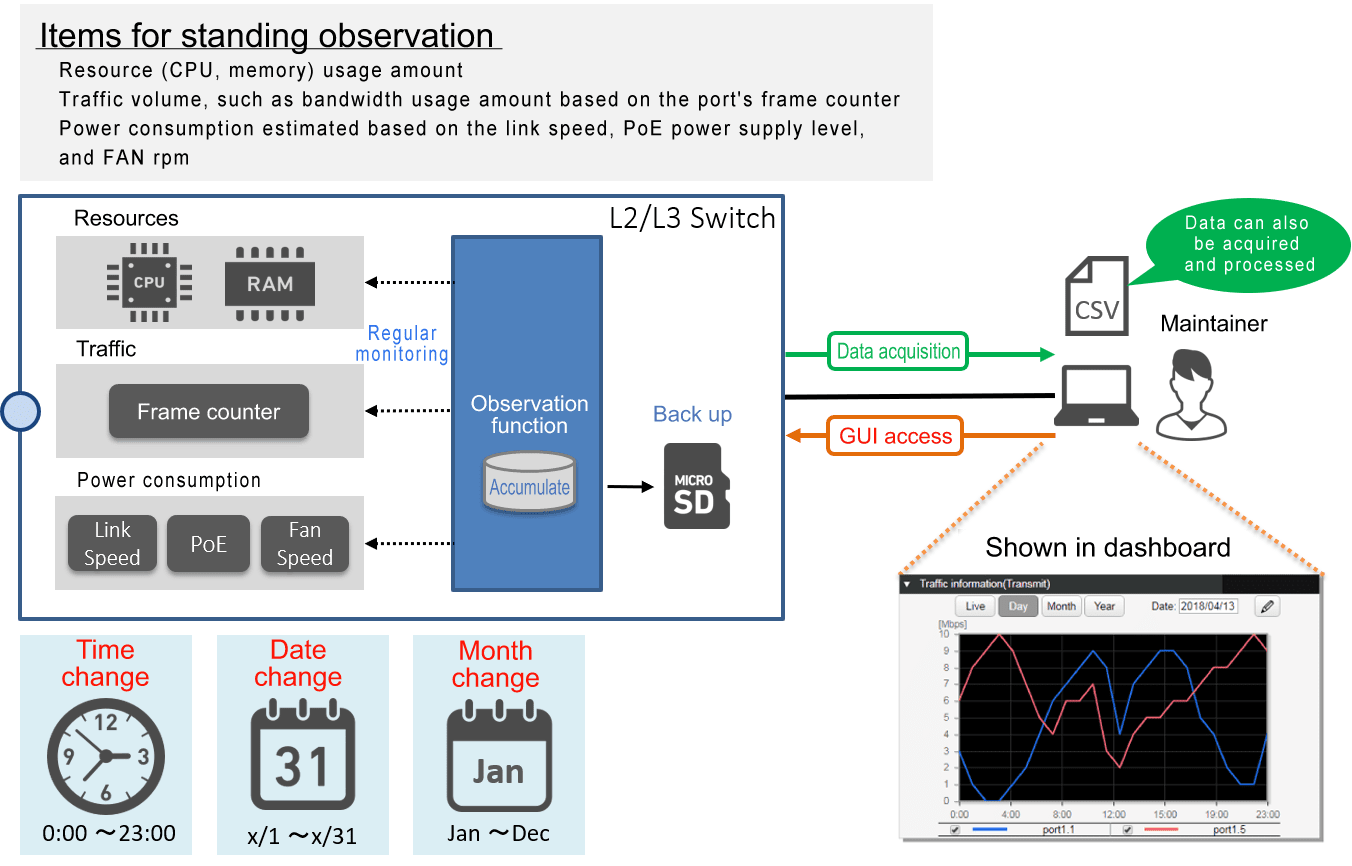
This product constantly observes the following three types of data.
-
Resource usage amount: CPU and memory usage amount
-
Traffic volume: The volume of communication port bandwidth used (transmission/reception)
-
Power consumption: Estimated based on the link speed, PoE power supply level, and fan RPM
Based on the results of observation, one year’s worth of the following change data is accumulated inside this product.
-
Hourly change: Change for each hour (e.g. 0:00, 1:00, ...)
-
Daily change: Change for each day of each month (e.g. 1/1, 1/2, ...)
-
Weekly change: Change for each day of the week (e.g. SUN, MON, ...)
-
Monthly change: Change for each month (e.g. Jan, Feb, ...)
The accumulated data can be backed up to an SD card. *
By accessing this product via the Web GUI, the maintenance personnel can view the various types of change data including live data in the dashboard, and can also acquire the accumulated result in a PC.
Since the acquired data is in *CSV format, it can also be manipulated using spreadsheet software on a PC.
Maintenance personnel can use this functionality for the following purposes.
-
Determine the short-term communication status
-
Predict long-term network equipment demand
-
Notice wasteful power consumption by determining current power consumption levels