Map screen
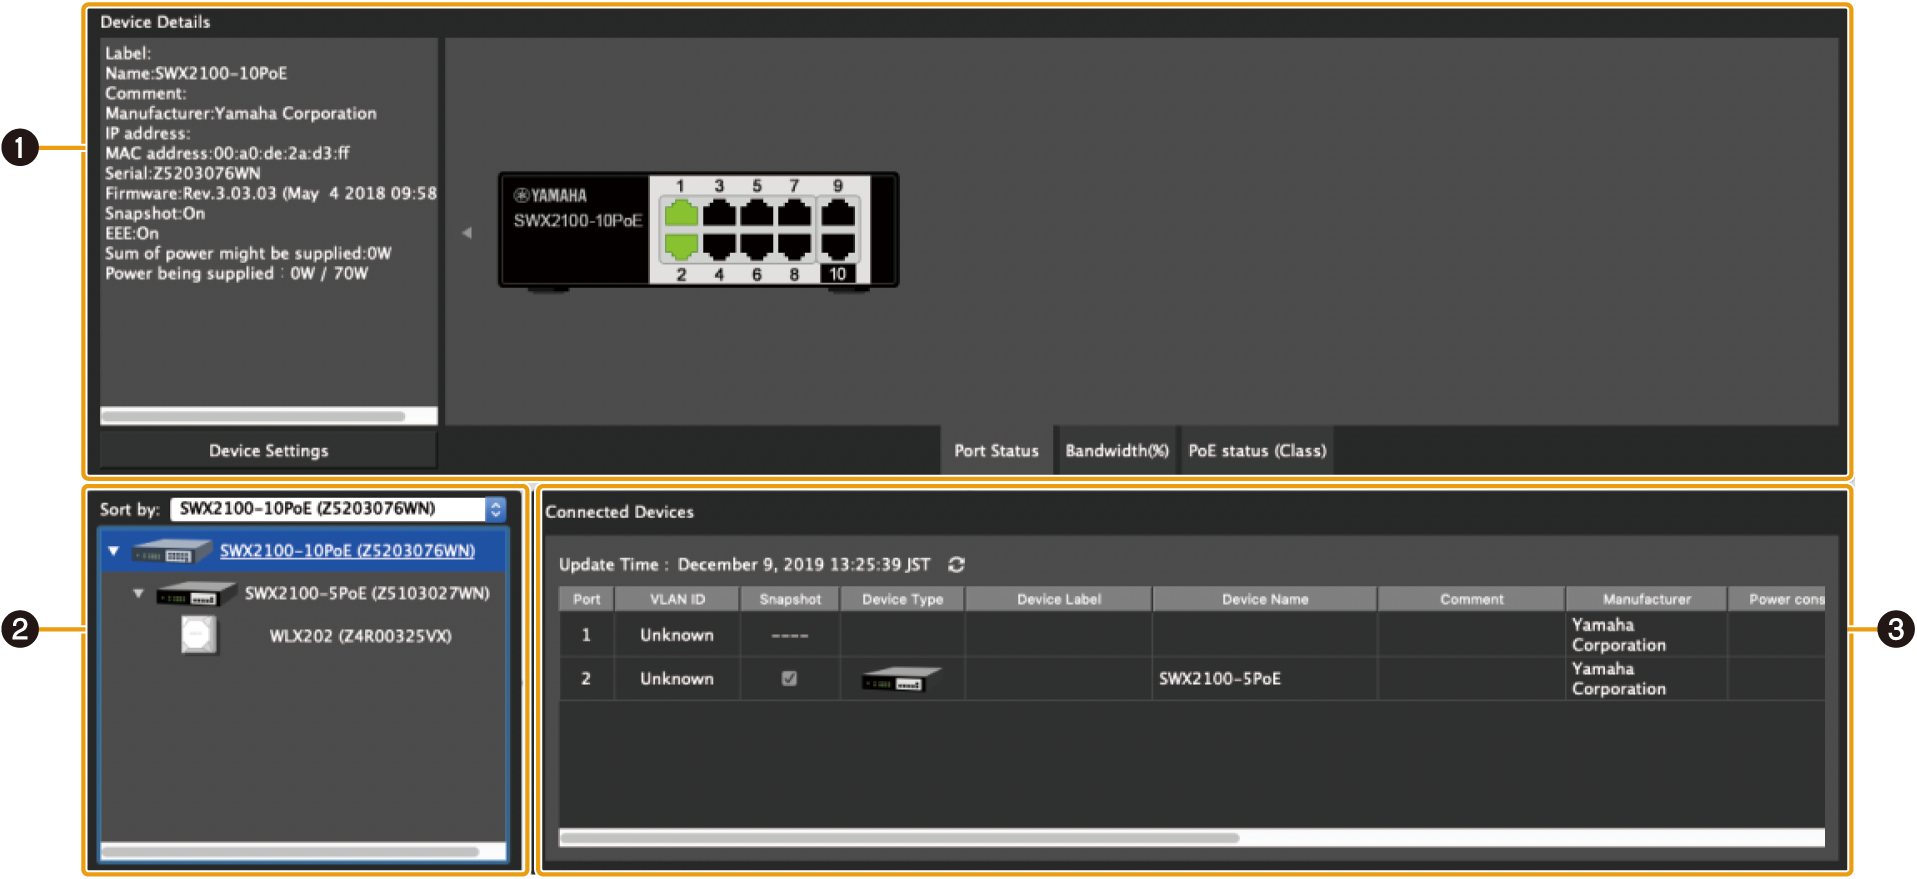
1. “Device Details” view
This shows detailed information about the device that is selected in the tree view.
The left side shows detailed information about the device, and the right side shows port information and information on the Dante-enabled device. The displayed contents will vary depending on the device in use.
For a Dante-enabled device
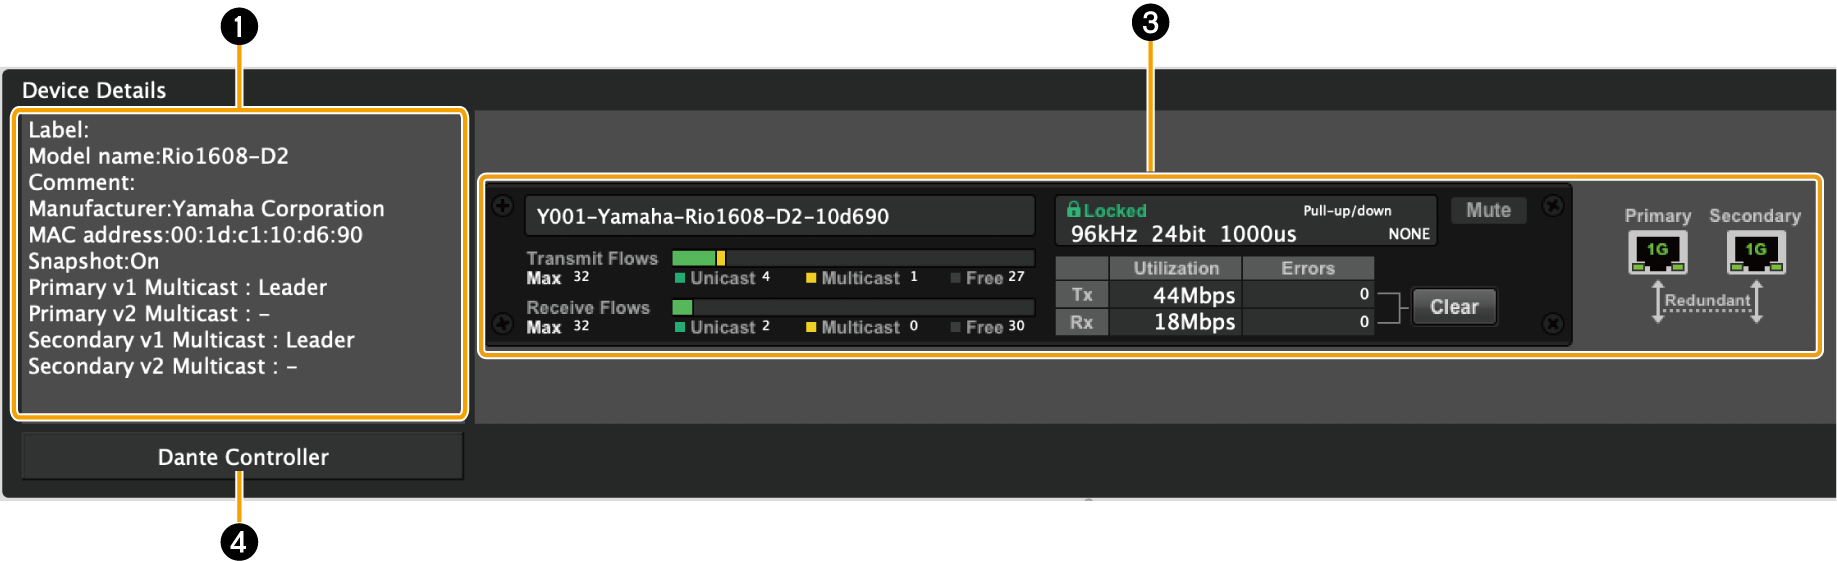
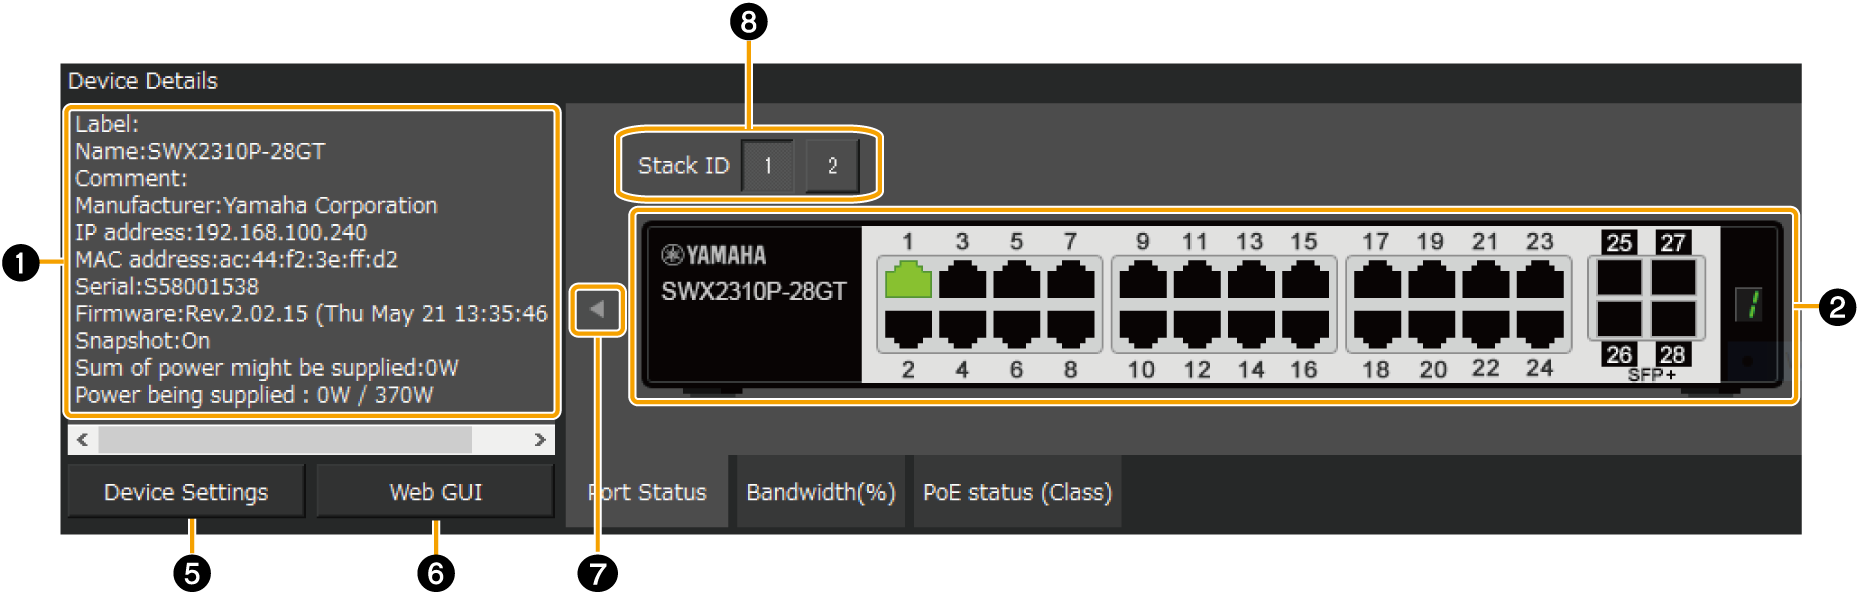
- ❶ Device Details
-
This area shows the following information. Depending on the device, some items will not be shown.
“Label”
Shows the device label that was entered in the “Device Settings” dialog box or the “Connected Devices” view.
“Model name”
Shows the model name of the device.
“Comment”
Shows the comment that was entered in the “Connected Devices” view. You can freely enter information about the on-site cabling or the role of the device.
“Manufacturer”
Shows the manufacturer name of the device.
“IP address”
Shows the IP address of the device. The IP address of the device can be changed in the “Device Settings” dialog box. This field is left blank for devices without an IP address.
“MAC address”
Shows the MAC address of the device.
“Serial”
Shows the serial number of the device.
“Firmware”
Shows the firmware revision of the device.
“Snapshot function”
Shows whether the device is monitored by the Snapshot function (On) or not monitored (Off).
“EEE”
Shows whether the power-saving function is enabled or disabled. This shows either Economy Mode or Normal Mode for SWX2200 series devices.
“Fan Status”
For a switch with a built-in fan, shows whether the fan is operating normally or malfunctioning.
“Fan RPM”
Shows the fan RPM for a switch with a built-in fan.
“Internal temperature”
Shows the internal temperature of the switch.
“Sum of power might be supplied”
Shows the sum of the maximum power capacity supplied to the switch-connected device. Note that the power supply may be interrupted, depending on the condition, if this value exceeds the limitation of the maximum power supply capacity for the PoE switch.
“Power being supplied”
Shows the total power supplied from each port on the switch and from the entire device.
“Link aggregation”
Shows the link aggregation type.
“Primary v1 Multicast”
Shows the clock status of the PTPv1 on the primary port.
“Primary v2 Multicast”
Shows the clock status of the PTPv2 on the primary port.
“Secondary v1 Multicast”
Shows the clock status of the PTPv1 on the secondary port.
“Secondary v2 Multicast”
Shows the clock status of the PTPv2 on the secondary port.
- ❷ Port status
-
This area shows a graphic representation of information concerning the Yamaha switch and Dante-enabled devices. Use the tabs located below the graphic to switch the information that is shown.
-
[Port Status] tab: Shows the connection status and communication speed of each port.
-
[Bandwidth(%)] tab: Shows the bandwidth usage of each port. (For switches only)
-
[PoE status (Class)] tab: This area shows the power supply status for each port. (For PoE-enabled switches only)
For more details on the graphic display, refer to “Port icons in the “Device Details” view”.
The bandwidth usage update interval can be changed in the “Basic Settings” dialog box, under “Information update interval for selected agent” - “Bandwidth”. -
- ❸ Information for the Dante-enabled device
-
This area shows information for the Dante-enabled device. To display information for the Dante-enabled device, Dante Control and Monitoring must be installed.
Name
Shows the label of the Dante-enabled device.
“Transmit Flows”
Shows the transmit flow status.
“Receive Flows”
Shows the receive flow status.
“Locked” / “Unlocked” indicator
Indicates whether the audio signal is locked or unlocked.
Sampling frequency / bit-length / latency
Shows the sampling frequency, bit-length, and latency of the audio signal. The latency is shown in μ second units.
“Pull-up/down”
Shows the sampling rate pull-up/pull-down setting.
“Mute” indicator
Lit in red when the Dante-enabled device is muted.
“Tx” / “Rx”
Shows information about Dante transmission and reception.
[Utilization] : Shows the current amount of transmission and reception in kbps units.
[Errors] : Shows the number of errors that occurred during transmission and reception. The [Clear] button located at the right resets the indication of the [Errors] field to 0.“Primary” / “Secondary”
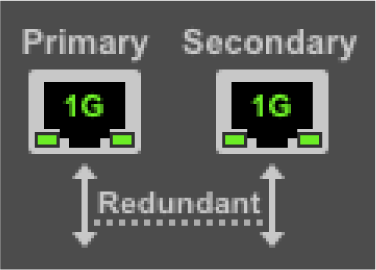
Shows the status of the Dante “Primary” port and “Secondary” port.
The link speed is shown inside the graphic of the port.
The setting of the Dante “Secondary” port is shown below the graphic of the ports.
|
For more about transmit flow and receive flow, and unicast and multicast, visit the following Yamaha Pro Audio site, navigate to [Training & Support] → [Self-Training] → [Dante Network Design Guide], and refer to [Multicast Settings]. https://asia-latinamerica-mea.yamaha.com/en/products/proaudio/ |
- ❹ [Dante Controller] button
-
You can click this to start Dante Controller and configure Dante settings, such as patching. If Dante Controller is not installed, an error message appears.
For details on using Dante Controller, refer to the Dante Controller User Guide. - ❺ [Device Settings] button
-
This shows the “Device Settings” dialog box.
For details, refer to “Device Settings” dialog. - ❻ [Web GUI] button (shown only for an agent device with a Web GUI)
-
When you click this, the Web GUI of the device currently selected in the tree appears in the default browser.
In the Web GUI, you can configure settings for Yamaha switch and Yamaha wireless LAN access point and manage them.
For details, refer to “Logging in to the Web GUI”. - ❼ Button to show/hide device details
-
Click the button to switch whether device details are shown or hidden.
For Dante-enabled devices, the switch button is not shown.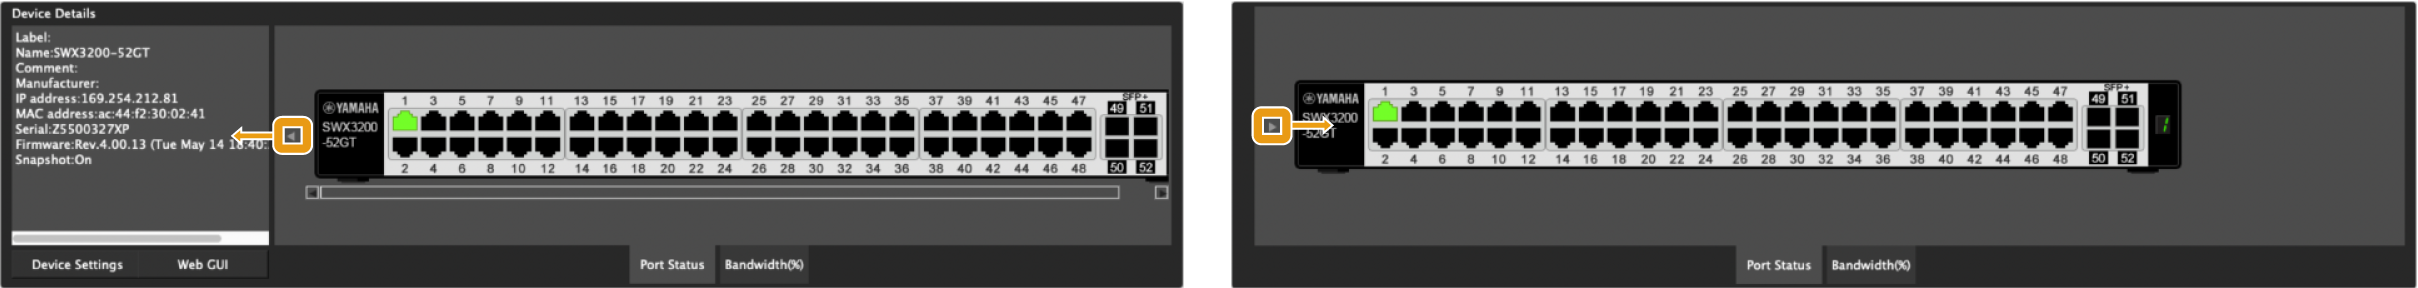
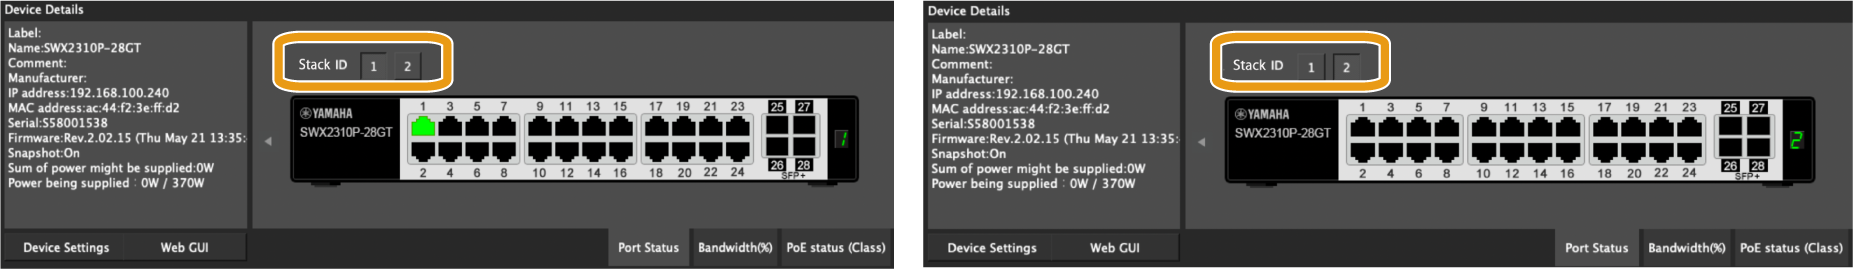
- ❽ Button to switch Stack ID (shown only for an agent device with stack function enabled)
-
When you click this, the port information of the device with the selected stack ID is displayed.
2. Tree view
This area shows the Yamaha switch, and Dante-enabled devices detected by Yamaha LAN Monitor. The device name and the number of connected devices (agent devices only) are shown at the right of the icon; when you click the open/close button [>] located at the left of the icon, the devices connected below that agent device are shown.
| This will not function until a Yamaha switch is found. |
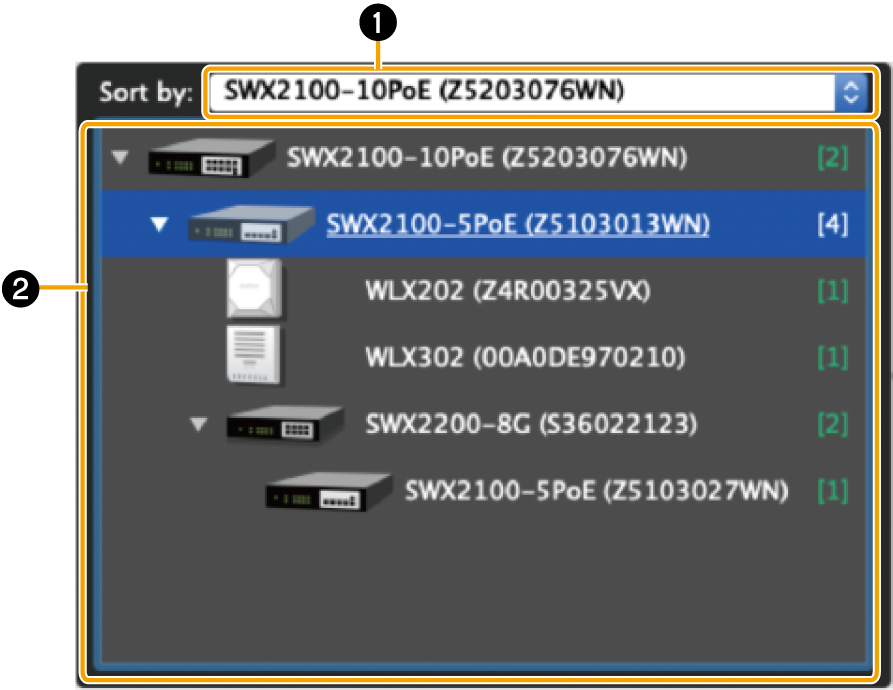
- ❶ Sorting order reference node selection pull-down menu
-
Selects the Yamaha switch that you want to appear at the top of the tree view. These are shown in their connection order relative to the selected Yamaha switch.
-
Only the Yamaha switch for the current network will appear in the sorting order reference node selection pull-down menu.
-
When starting Yamaha LAN Monitor, the Yamaha switch closest to the computer will serve as the starting point for the tree view.
-
- ❷ Tree view
-
This area shows the Yamaha switch, and Dante-enabled devices detected by Yamaha LAN Monitor.
If a device that was saved in the snapshot is no longer found, or if the connection port is different, a red error icon ( ) is shown for the agent that is above the corresponding device. If a device that was not saved previously is newly found, a blue notification icon (
 ) appears on the agent that is above the corresponding device. Of the Dante-enabled devices, a green flag icon (
 ) appears on the PTP Leader (Primary) device, and an orange flag icon (
 ) appears on the PTP Leader (Secondary) device.
3. “Connected Devices” view
When you click a Yamaha switch shown in the tree view, a list of the connected devices is shown in the “Connected Devices” view.
The “Connected Devices” view is updated each time that the time specified in “Information update interval of the selected agent” - “Status of each function” of “Basic Settings” has elapsed.
When you click the [Refresh] button of the “Connected Devices” view, information for the devices connected to the agent is refreshed.
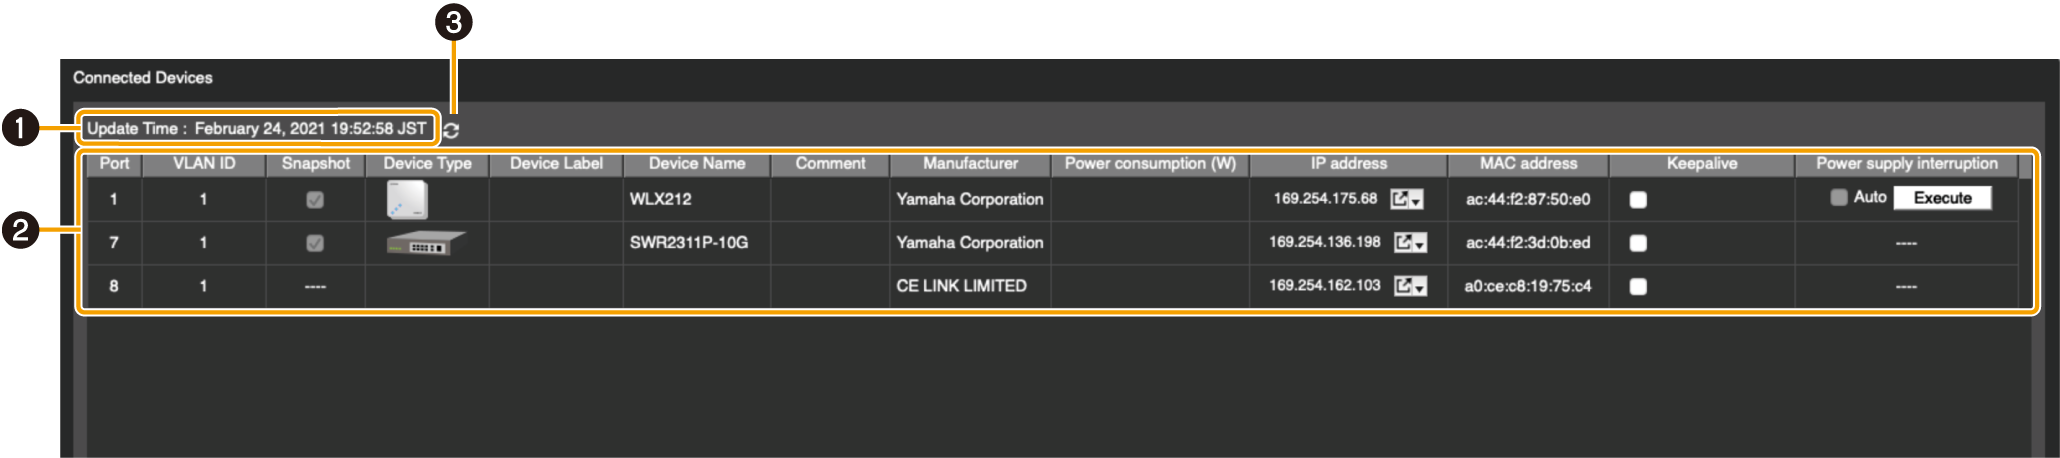
- ❶ “Update Time:”
-
Shows the date and time at which information was last captured for the devices that are connected to the Yamaha switch or Yamaha wireless LAN access point that is selected in the “Tree” view.
- ❷ List
-
Shows a list of information for the devices that are connected to the agent that is selected in the “Tree” view.
Depending on the device, some items will not be shown. Click the title row to sort according to the item clicked.“Port”
Shows the port number of the agent to which the device is connected. The switch port numbers that support the stack function are displayed in the format “[Stack ID].[Port number]”. If a Dante device has multiple logical ports for a single physical port, they are all shown with the same port number. On Yamaha Dante-enabled devices, there is no need to pay particular attention to non-Dante ports.
“VLAN ID”
Shows the VLAN ID joined by the port to which the device is connected.
When multiple VLAN IDs are set, each VLAN ID will be separated with a comma. Maximum of 9 (trunk=8, access=1).
The access port (A), and trunk port (T) will appear after the VLAN ID. However, (A) will not appear when only the access port is in use.“Snapshot”
Specifies whether each device is included as a target of the snapshot function.
Users can switch settings only for the devices other than agents.
Agents cannot be changed.“Device Type”
Shows an icon that indicates the type of device. If device is terminal that except Dante-enabled device, you can switch the icon that is displayed.
[Device Label]
You can enter a character string to identify the individual device.
[Model name]
Shows the model name of the device. Some devices allow you to input and edit the device name.
[Comment]
Allows you to freely assign a comment. You can enter information about the on-site cabling or the role of the device.
[Manufacturer]
Shows the manufacturer name of the device. Some devices allow you to input and edit the manufacturer name.
[Power consumption (W)]
Enter the maximum power consumption of the device over a range of 0.0 – 90.0.
Enter the maximum power consumption of the connected device, when known, to obtain an accurate view of the sum of the maximum power that might be supplied to the connected device.
If [Power consumption (W)] is not entered, the maximum power supply defined for the power supply class will be used to calculate the [Sum of power might be supplied].“IP address”
Shows the IPv4 address of the device.
-
 button (opens the Web browser) : this opens the registered URL in the Web browser.
This button is only displayed for connected devices whose IP address can be acquired.
The destination URL is registered as the URL shown below by default.
http://<IP_ADDR>/
Note: “<IP_ADDR>” is the IP address of a connected device acquired by the Yamaha LAN Monitor
Press the button to open the registered URL in the Web browser.
Press to display the context menu for the following items.
 -
Access via Web browser
Opens the registered URL in the Web browser -
Destination URL settings
Opens the destination URL settings dialog box.
In the destination URL settings dialog box, you can set the [Destination URL] that is used when pressing the “Open in Web browser” button.
“MAC address”
Shows the MAC address of the device.
[Keepalive]
Select this check box to perform keepalive checks on the device. If this check box is selected, Yamaha LAN Monitor pings the device to perform keepalive checks according to settings configured in the “Basic Settings” dialog box.
Selecting this check box will display the following depending on the circumstances.-
Checking: Now checking.
-
UP: Successfully detected device.
-
DOWN: Failed to detect device.
[Power supply interruption]
Restart devices directly connected to the PoE-enabled Yamaha switch by turning the power supply on and off.
The duration of power supply interruption is set in the “Basic Settings” dialog box by configuring the “Power supply interruption time”.-
[Auto] check box: Select this check box to temporarily turn off the power supply to devices that could not be detected using [Keepalive]. This setting is only available when the [Keepalive] check box is selected.
-
[Execute] button: This manually interrupts the power supply. While off, a “Stopped” message will appear.
-
If multiple Dante-enabled devices are connected in a daisy-chain, the other devices are also shown together at the same port number as the device that is connected immediately below the switch.
-
Of the settings in the above list, the settings of “Device Type”, [Device Label], [Model name], [Manufacturer], [Keepalive], [Power supply interruption] and [Destination URL] can be moved to another computer by using the [Setup] menu commands [Export Label Settings] and [Import Label Settings].
Note that the “Label Settings file” generated by this software version cannot be imported to the software version 1.3.6 or earlier. -
Note that a snapshot notification will not be provided even if the keepalive status changes from “UP” to “DOWN.”
- List entry
-
To enter information in a list, or edit entered information, double click a cell.
Entries up to the following character counts and within the following ranges are permitted.-
[Device Label], [Model name], [Comment], [Manufacturer] : Up to 128 characters
-
[Power consumption (W)] : Up to the first decimal place within a range of 0.0 – 90.0
Content entered into the [Device Label] and [Comment] fields are shared with “Device Settings” dialog box. Changing entries in one will change the corresponding entry for the other. -
- Show connection status
-
A snapshot saves the connected state of the devices at the time that you started monitoring.
Subsequently, if a device saved in the snapshot is no longer found, the corresponding device is shown in red. If a device that had not been saved previously is newly found, the corresponding device is shown in blue.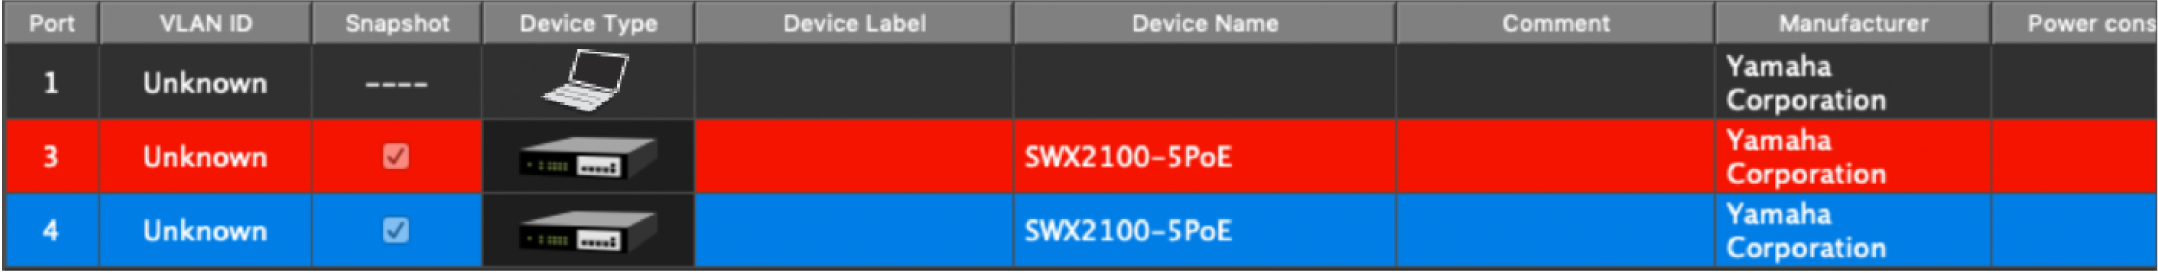
-
- ❸ [Refresh] button
-
Refreshes the information for the other agents or devices that are connected to the agent selected in the tree view.